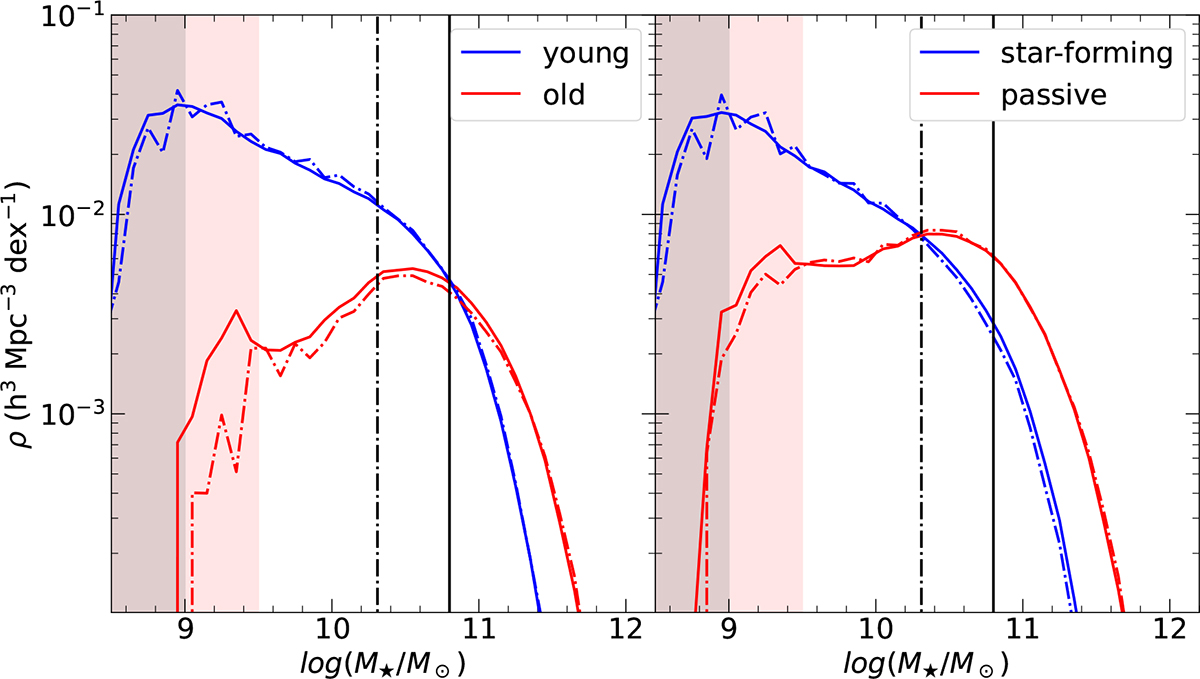
Fig. 10.
Download original image
Mass function of the S/N ≥ 10 (solid lines) and S/N ≥ 20 (dot-dashed lines) galaxy samples, including aperture corrections. Galaxies are divided into young (blue) and old (red), following the division described in Sect. 4.2(left panel) and divided into star-forming (blue) and passive (red), following the Gallazzi et al. (2021) separation, as per Eq. (8) (right panel ). The solid and dot-dashed black lines identify the transition masses obtained from the mass-functions, for the separations based on the age and SFR, respectively. The shaded areas identify the mass ranges where our sample is not representative, namely ≲M⋆ ∼ 109.5 M⊙ for passive/old galaxies (red shading), ≲M⋆ ∼ 109 M⊙ for star-forming and young galaxies (grey shading). Notably, the statistical weights ensure that we recover consistent mass functions irrespective of the S/N cut.
Current usage metrics show cumulative count of Article Views (full-text article views including HTML views, PDF and ePub downloads, according to the available data) and Abstracts Views on Vision4Press platform.
Data correspond to usage on the plateform after 2015. The current usage metrics is available 48-96 hours after online publication and is updated daily on week days.
Initial download of the metrics may take a while.