Fig. 11.
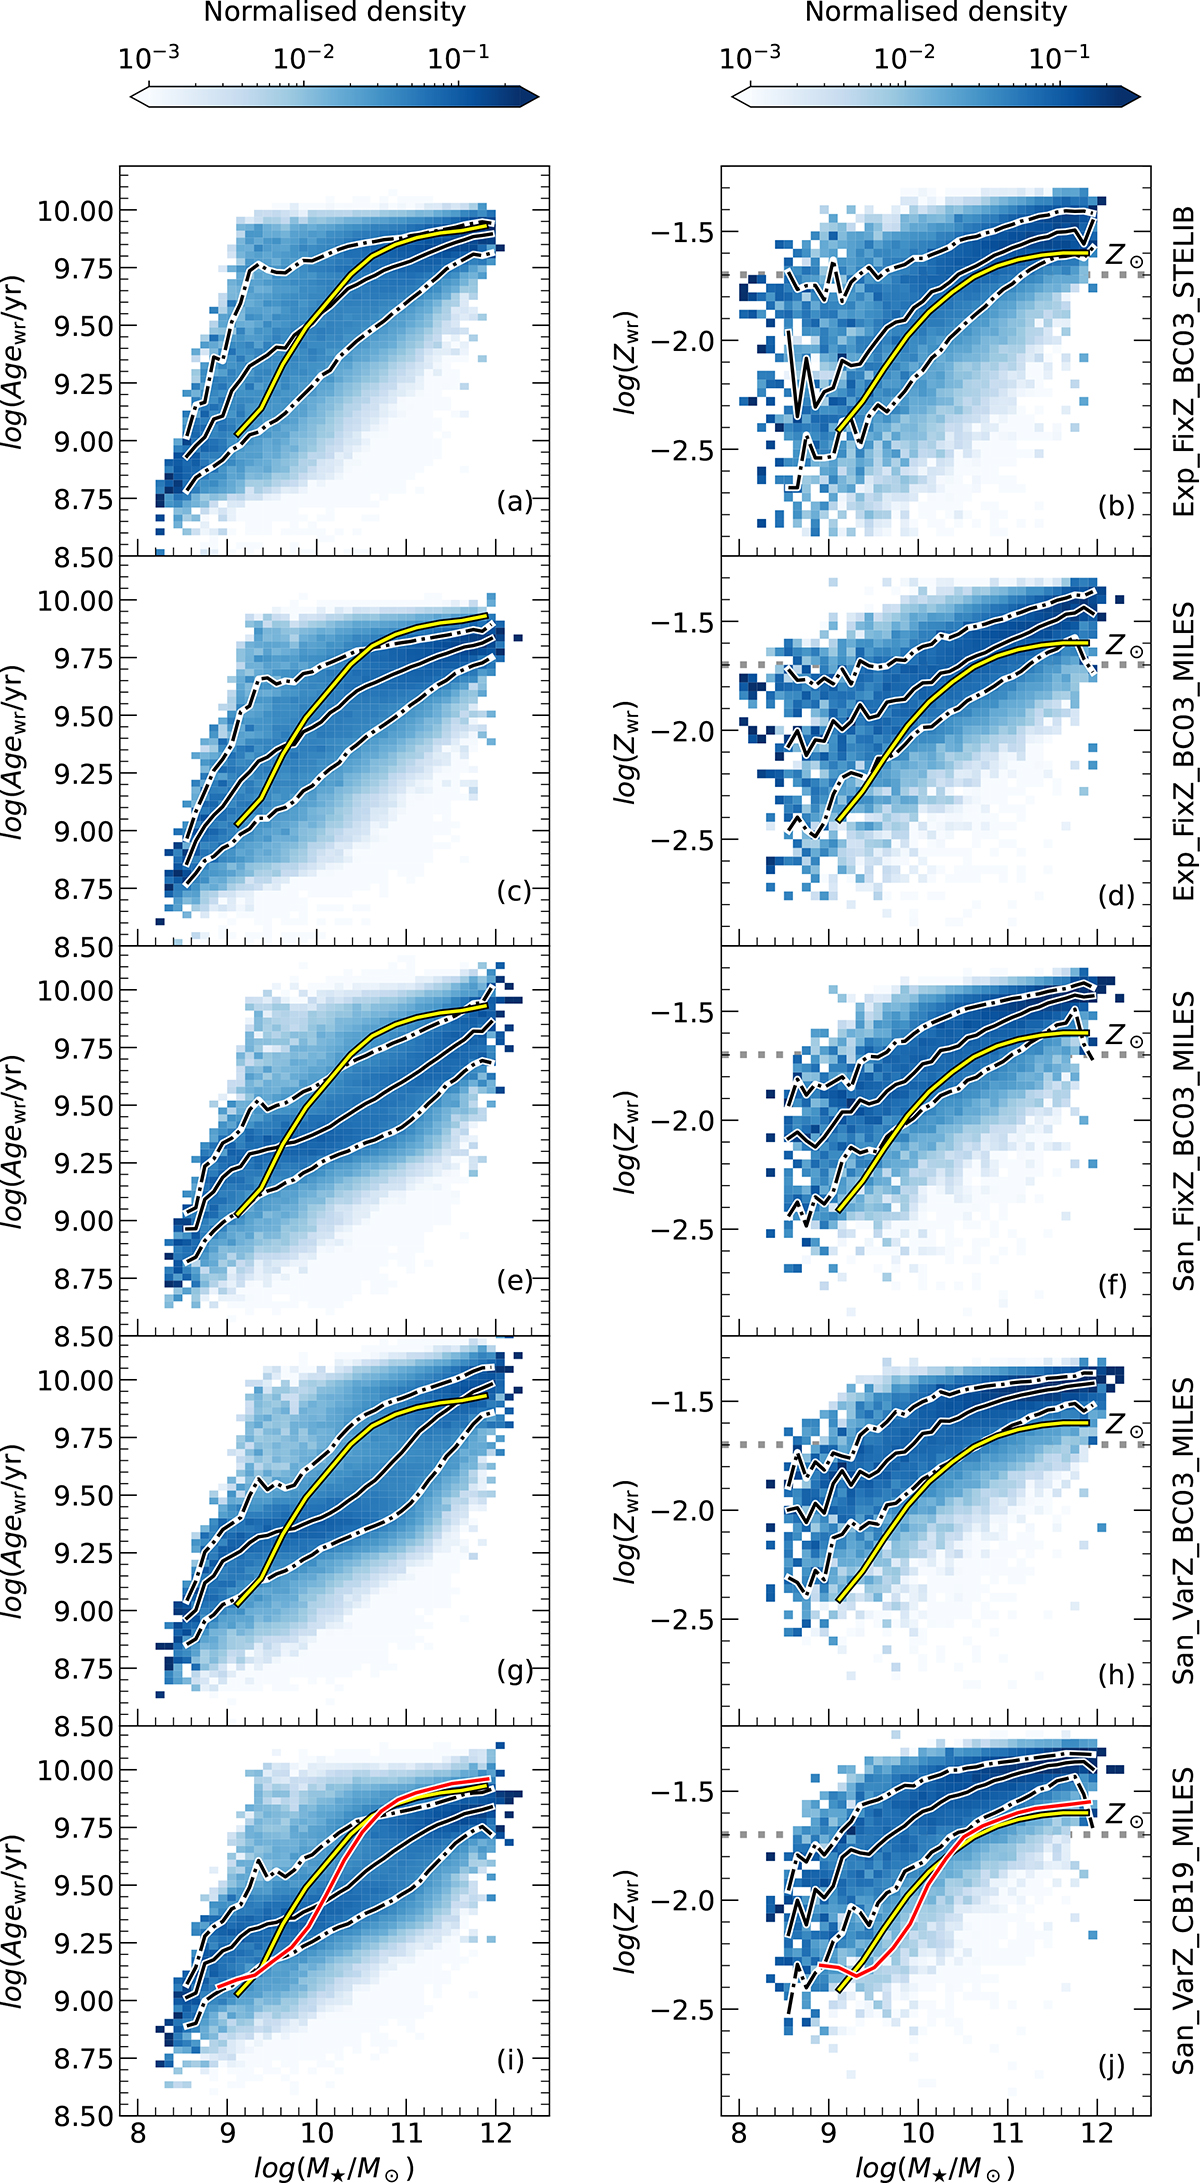
Download original image
Density of galaxies normalised in each mass bin (same as Fig. 8 from Gallazzi et al. 2005) for the mass-age (left) and mass-metallicity (right) relations obtained with each SPS model in Table 1 (one model in each row). In each panel the black solid and dashed lines identify the median and 16th and 84th percentiles of the corresponding distribution in mass bins, while the yellow line identifies the median relations in the respective plane taken from Gallazzi et al. (2021). The last row displays the distributions for the fiducial models of this work. In these panels, the red line represents the original G05 scaling relations. Note: these results are obtained without aperture corrections, for consistency with G05 and G21. The dotted horizontal lines in the mass-metallicity planes indicate the solar metallicity of Z⊙ ≡ 0.02.
Current usage metrics show cumulative count of Article Views (full-text article views including HTML views, PDF and ePub downloads, according to the available data) and Abstracts Views on Vision4Press platform.
Data correspond to usage on the plateform after 2015. The current usage metrics is available 48-96 hours after online publication and is updated daily on week days.
Initial download of the metrics may take a while.