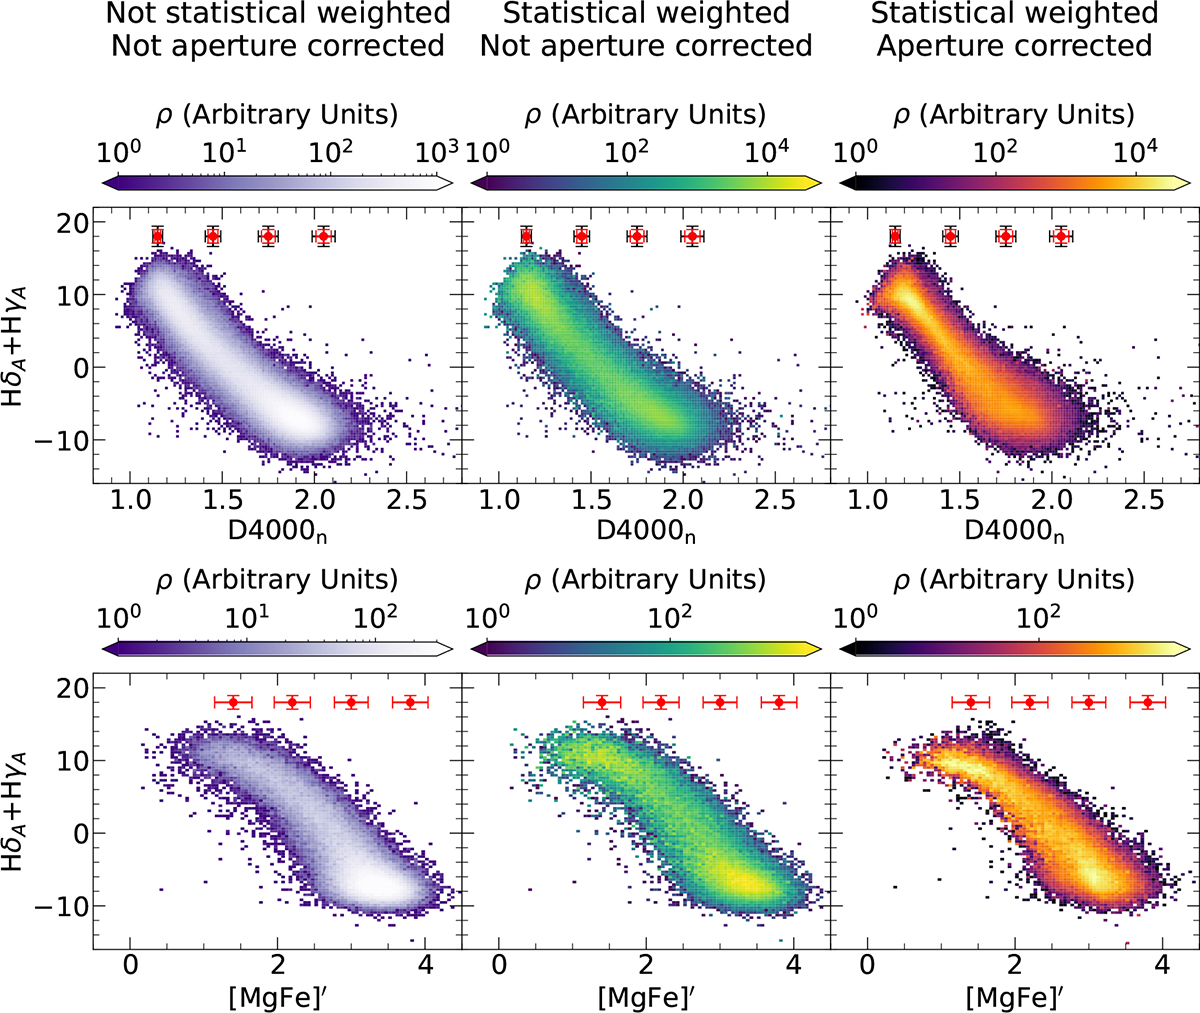
Fig. 2.
Download original image
Distribution of the galaxies in the HδA+HγA vs. D4000n and HδA+HγA vs. [MgFe]′ planes before and after the implementation of the statistical weights and the aperture corrections. Left panels: Distribution of the original data, i.e. simple number counts for uncorrected index values. Central panels: Distributions of galaxies weighted by the volume and completeness statistical corrections, for uncorrected index values. Right panels: Distributions obtained by implementing both the statistical weights and the corrections for aperture effects. The error bars correspond to the median uncertainties calculated in four bins of D4000n and [MgFe]′, for samples with S/N ≥ 20 (red) and S/N ≥ 10 (shown in black at the top).
Current usage metrics show cumulative count of Article Views (full-text article views including HTML views, PDF and ePub downloads, according to the available data) and Abstracts Views on Vision4Press platform.
Data correspond to usage on the plateform after 2015. The current usage metrics is available 48-96 hours after online publication and is updated daily on week days.
Initial download of the metrics may take a while.