Fig. 11.
Download original image
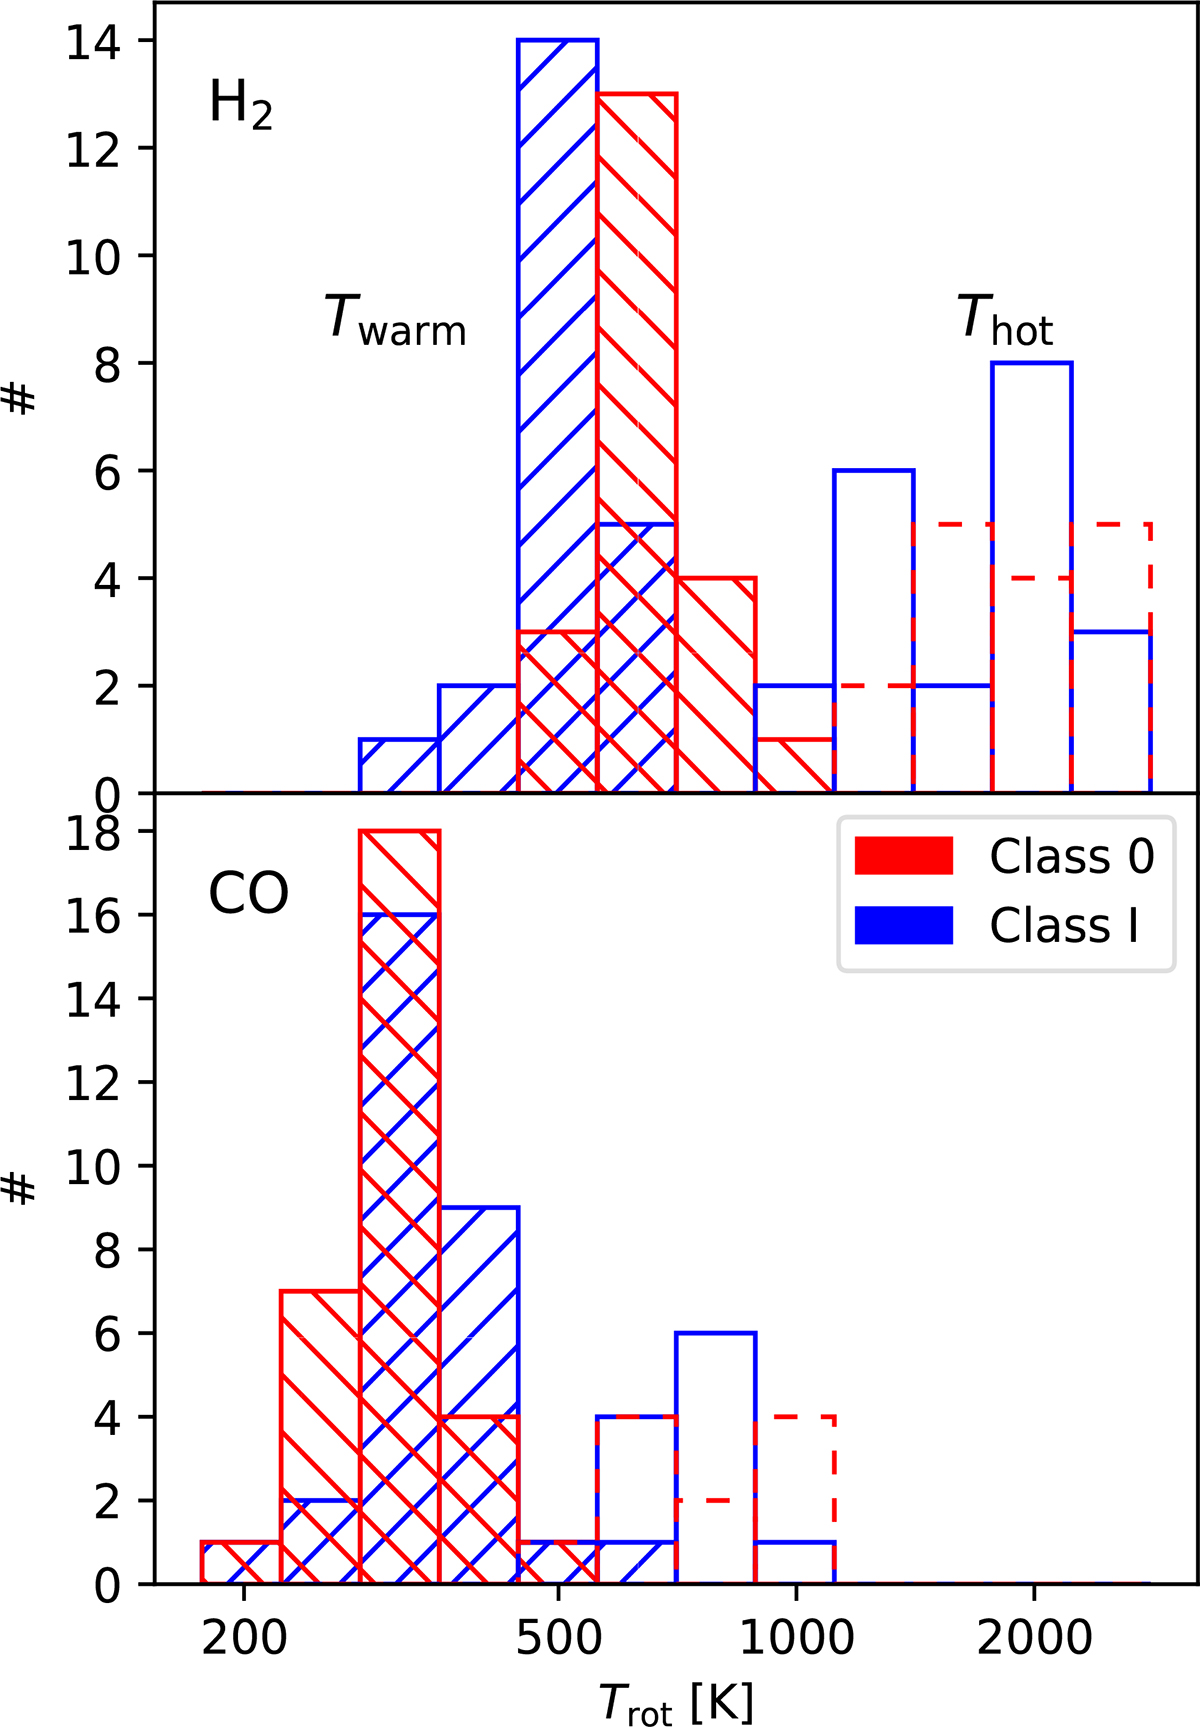
Distribution of the rotational temperatures of H2 (top) and high-J CO (bottom) in low-mass protostars. Temperatures in Class 0 protostars are shown in red, and in Class I sources in blue. The warm gas component is shown in stripped bins, and the hot one in clear bins. H2 results for Class 0 protostars are adopted from Francis et al. (2025), and CO results for both Class 0 and I are from Karska et al. (2018).
Current usage metrics show cumulative count of Article Views (full-text article views including HTML views, PDF and ePub downloads, according to the available data) and Abstracts Views on Vision4Press platform.
Data correspond to usage on the plateform after 2015. The current usage metrics is available 48-96 hours after online publication and is updated daily on week days.
Initial download of the metrics may take a while.