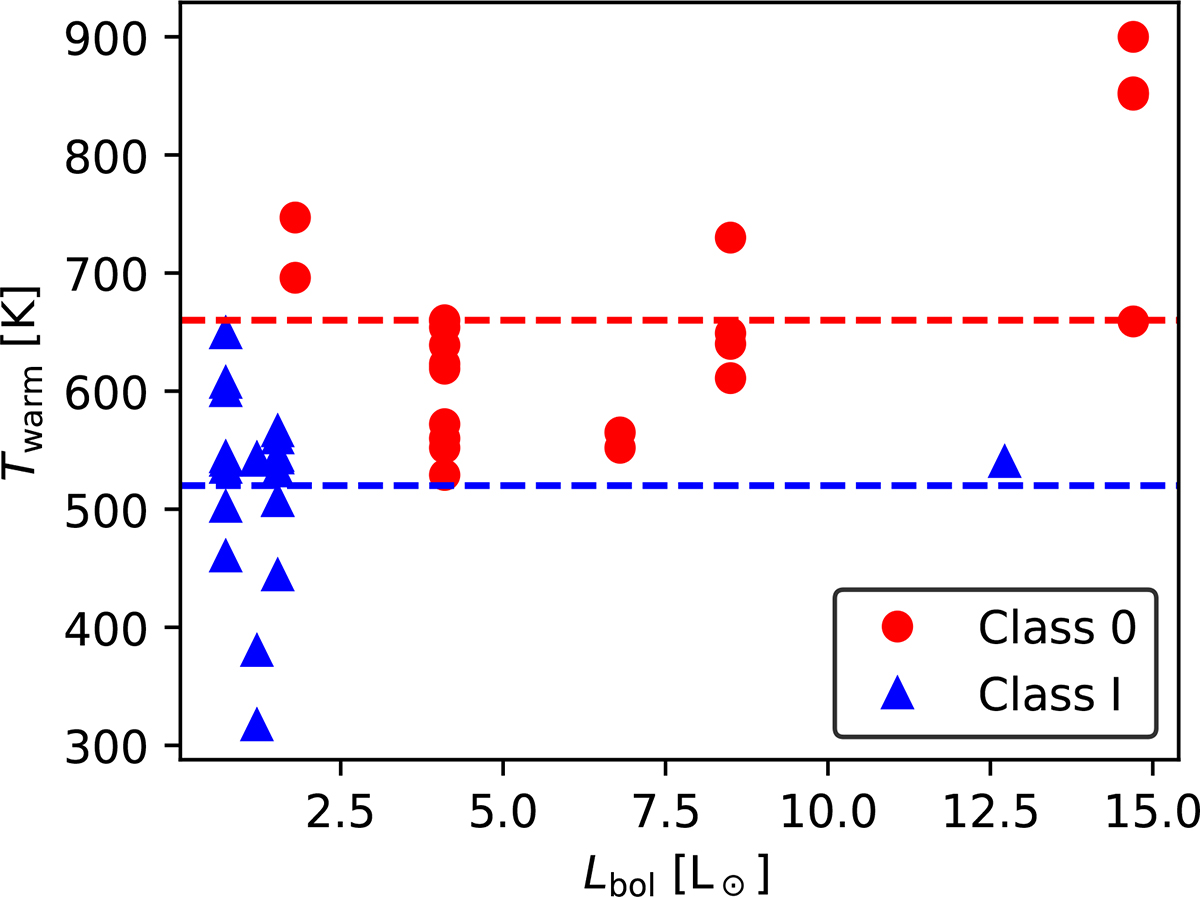
Fig. 12.
Download original image
Temperature of the warm gas component along the protostellar outflows over the bolometric luminosity of the corresponding driving source. Blue triangles show the Class I sources from this work and Tychoniec et al. (2024), while red circles show the Class 0 sample from Francis et al. (2025). Dashed blue and red lines show the mean values for the Class I and 0 sources, respectively.
Current usage metrics show cumulative count of Article Views (full-text article views including HTML views, PDF and ePub downloads, according to the available data) and Abstracts Views on Vision4Press platform.
Data correspond to usage on the plateform after 2015. The current usage metrics is available 48-96 hours after online publication and is updated daily on week days.
Initial download of the metrics may take a while.