Fig. 2.
Download original image
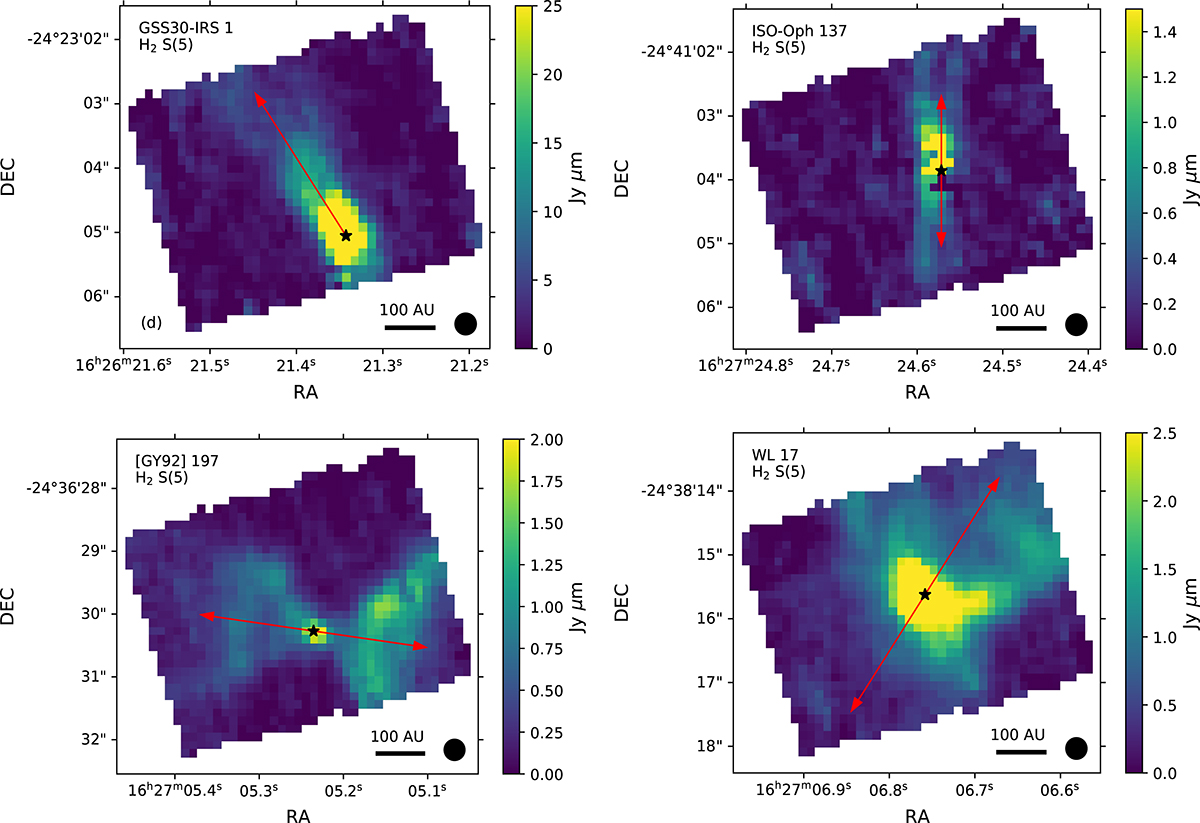
Integrated emission of H2 S(5) line at 6.91 μm toward GSS30-IRS 1, ISO-Oph 137, [GY92] 197, and WL 17. The positions of the protostars, measured from the line-free region at 6.9 μm, are shown with black stars. The red arrows shows the apparent outflow direction based on the H2 emission. The filled black circle marks the spatial resolution of MIRI at λ = 6.9 μm (∼0.2″).
Current usage metrics show cumulative count of Article Views (full-text article views including HTML views, PDF and ePub downloads, according to the available data) and Abstracts Views on Vision4Press platform.
Data correspond to usage on the plateform after 2015. The current usage metrics is available 48-96 hours after online publication and is updated daily on week days.
Initial download of the metrics may take a while.