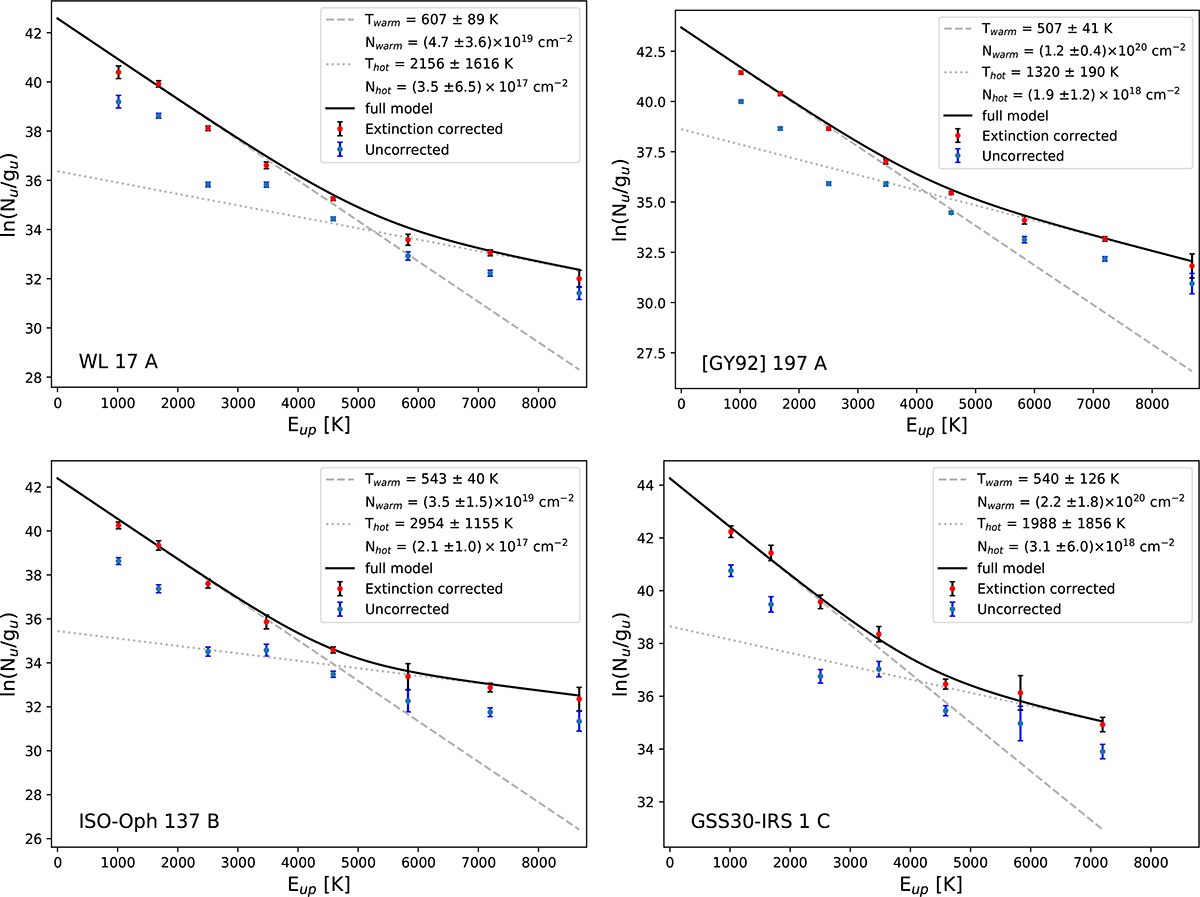
Fig. 5.
Download original image
H2 rotational diagrams for the outflow positions in WL 17, [GY92] 197, ISO-Oph 137, and GSS30-IRS 1 with the largest number of line detections. The natural logarithm of the column density from a level u, Nu, divided by the degeneracy of the level, gu, is written on the Y axis. The extinction-corrected values are shown in red, and the ones before the correction in blue. The two-component fits cover the transitions below and above Eu∼4000 K for the “warm” (dashed line) and “hot” (dotted line) component (see text). The combined fit is shown as a black line. Finally, letters next to source name mark the aperture where the H2 were measured.
Current usage metrics show cumulative count of Article Views (full-text article views including HTML views, PDF and ePub downloads, according to the available data) and Abstracts Views on Vision4Press platform.
Data correspond to usage on the plateform after 2015. The current usage metrics is available 48-96 hours after online publication and is updated daily on week days.
Initial download of the metrics may take a while.