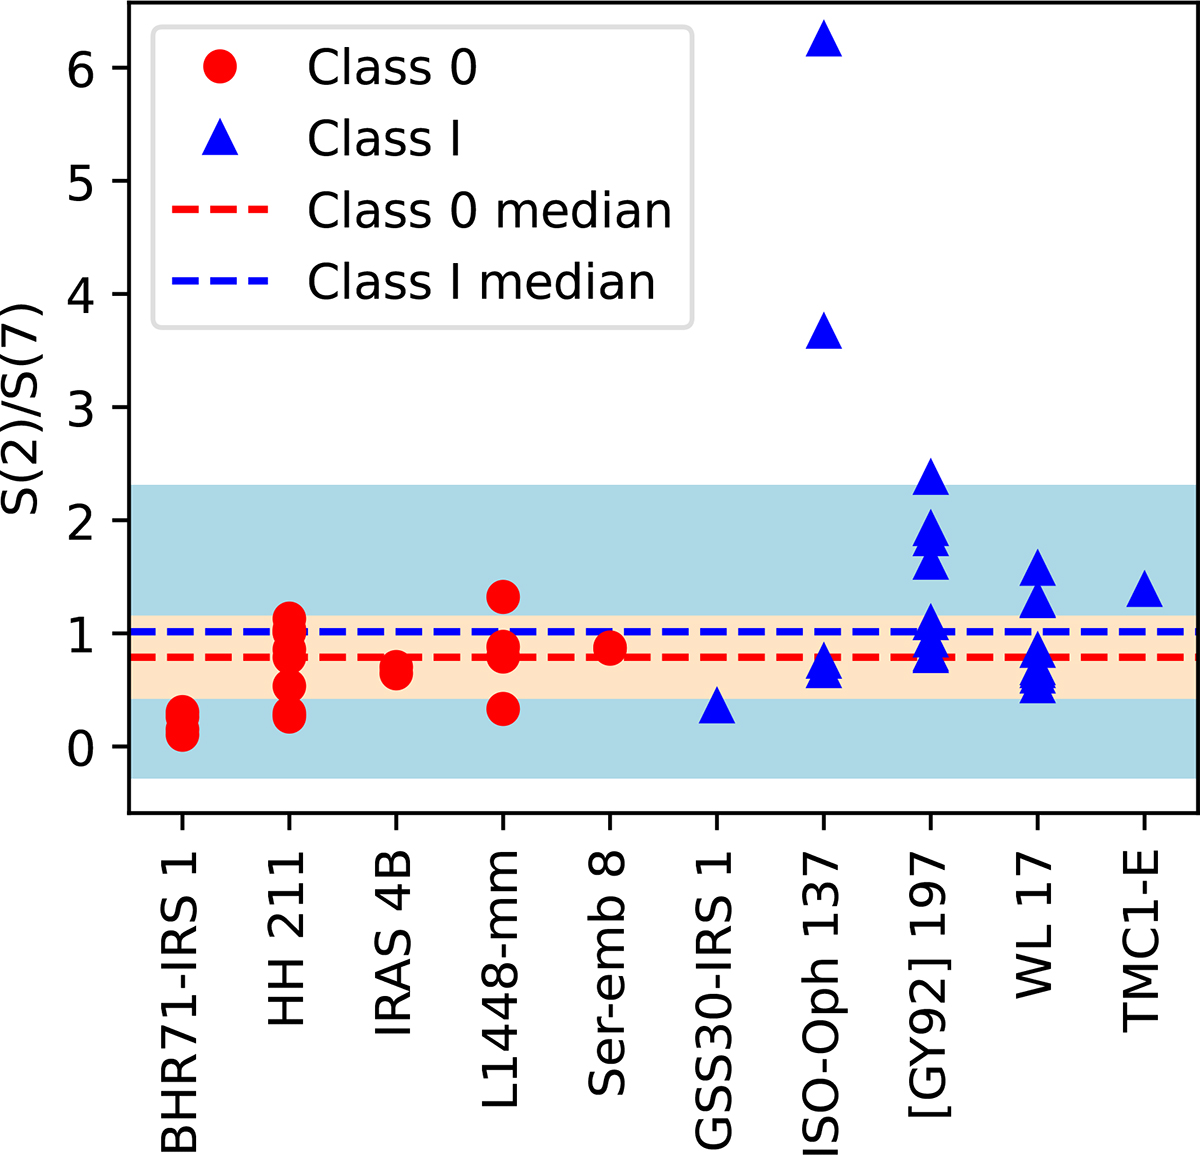
Fig. 7.
Download original image
Ratio of the S(2)/S(7) H2 emission lines in different low-mass protostellar sources. Red points mark Class 0 sources from Francis et al. (2025) and blue points are Class I sources from this work and TMC1-E from Tychoniec et al. (2024). The dashed lines mark the median values, 0.3 for Class 0 (in red) and 1.0 (in blue). Colored areas mark the median ± standard deviation range.
Current usage metrics show cumulative count of Article Views (full-text article views including HTML views, PDF and ePub downloads, according to the available data) and Abstracts Views on Vision4Press platform.
Data correspond to usage on the plateform after 2015. The current usage metrics is available 48-96 hours after online publication and is updated daily on week days.
Initial download of the metrics may take a while.