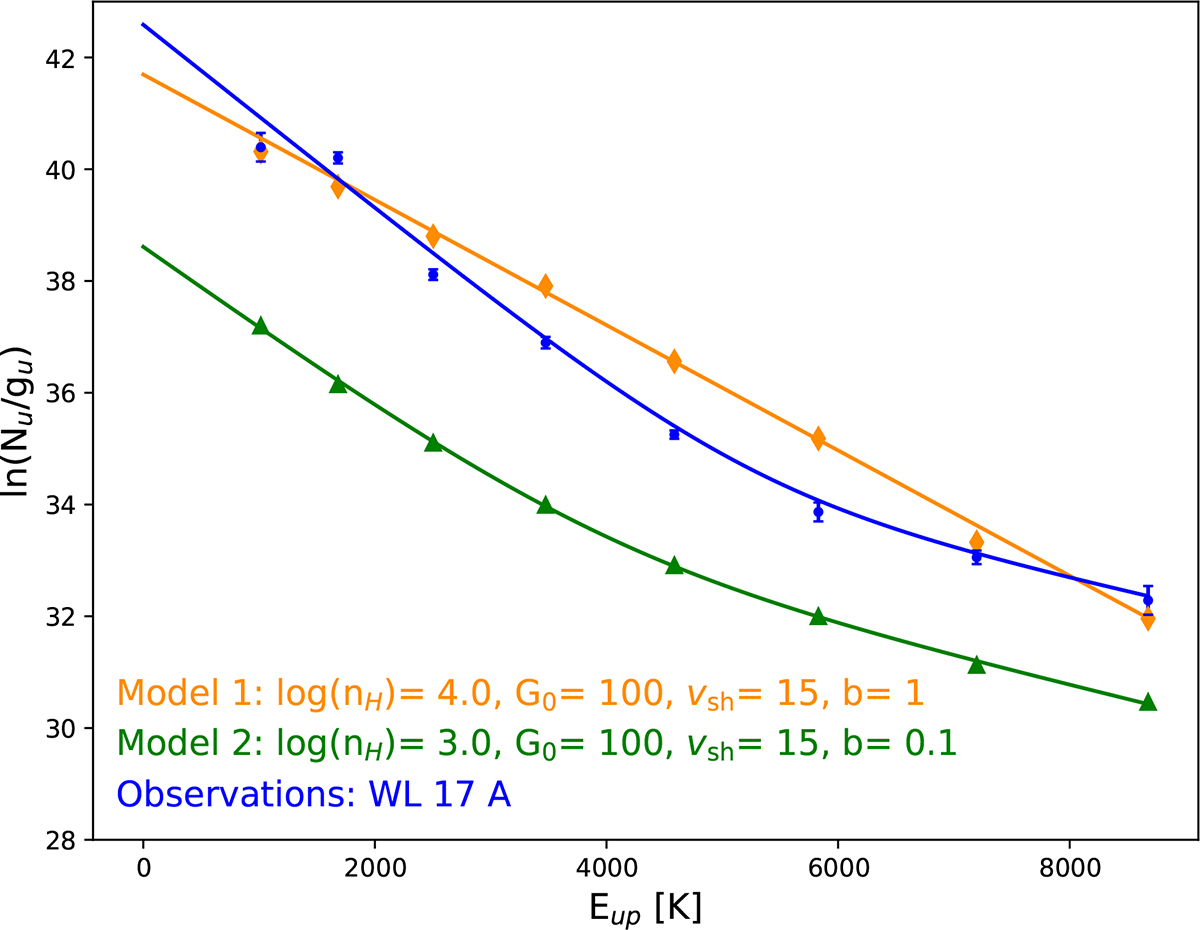
Fig. 9.
Download original image
Synthetic rotational diagrams based on the H2 intensities predicted for different combinations of parameters in the Kristensen et al. (2023) shock models. Green triangles show model results for nH = 103 cm−3, G0 = 100, vsh = 15 km s−1, b = 0.1, ζ = 10−17 s−1, and X(PAH) = 10−7. Orange diamonds show the model with nH = 104 cm−3, G0 = 100, vsh = 15 km s−1, b = 1, ζ = 10−17 s−1, and X(PAH) = 10−7. Blue points correspond to the observed values for aperture A of WL 17. Solid lines represent the best fit in each case.
Current usage metrics show cumulative count of Article Views (full-text article views including HTML views, PDF and ePub downloads, according to the available data) and Abstracts Views on Vision4Press platform.
Data correspond to usage on the plateform after 2015. The current usage metrics is available 48-96 hours after online publication and is updated daily on week days.
Initial download of the metrics may take a while.