Open Access
Fig. 10.
Download original image
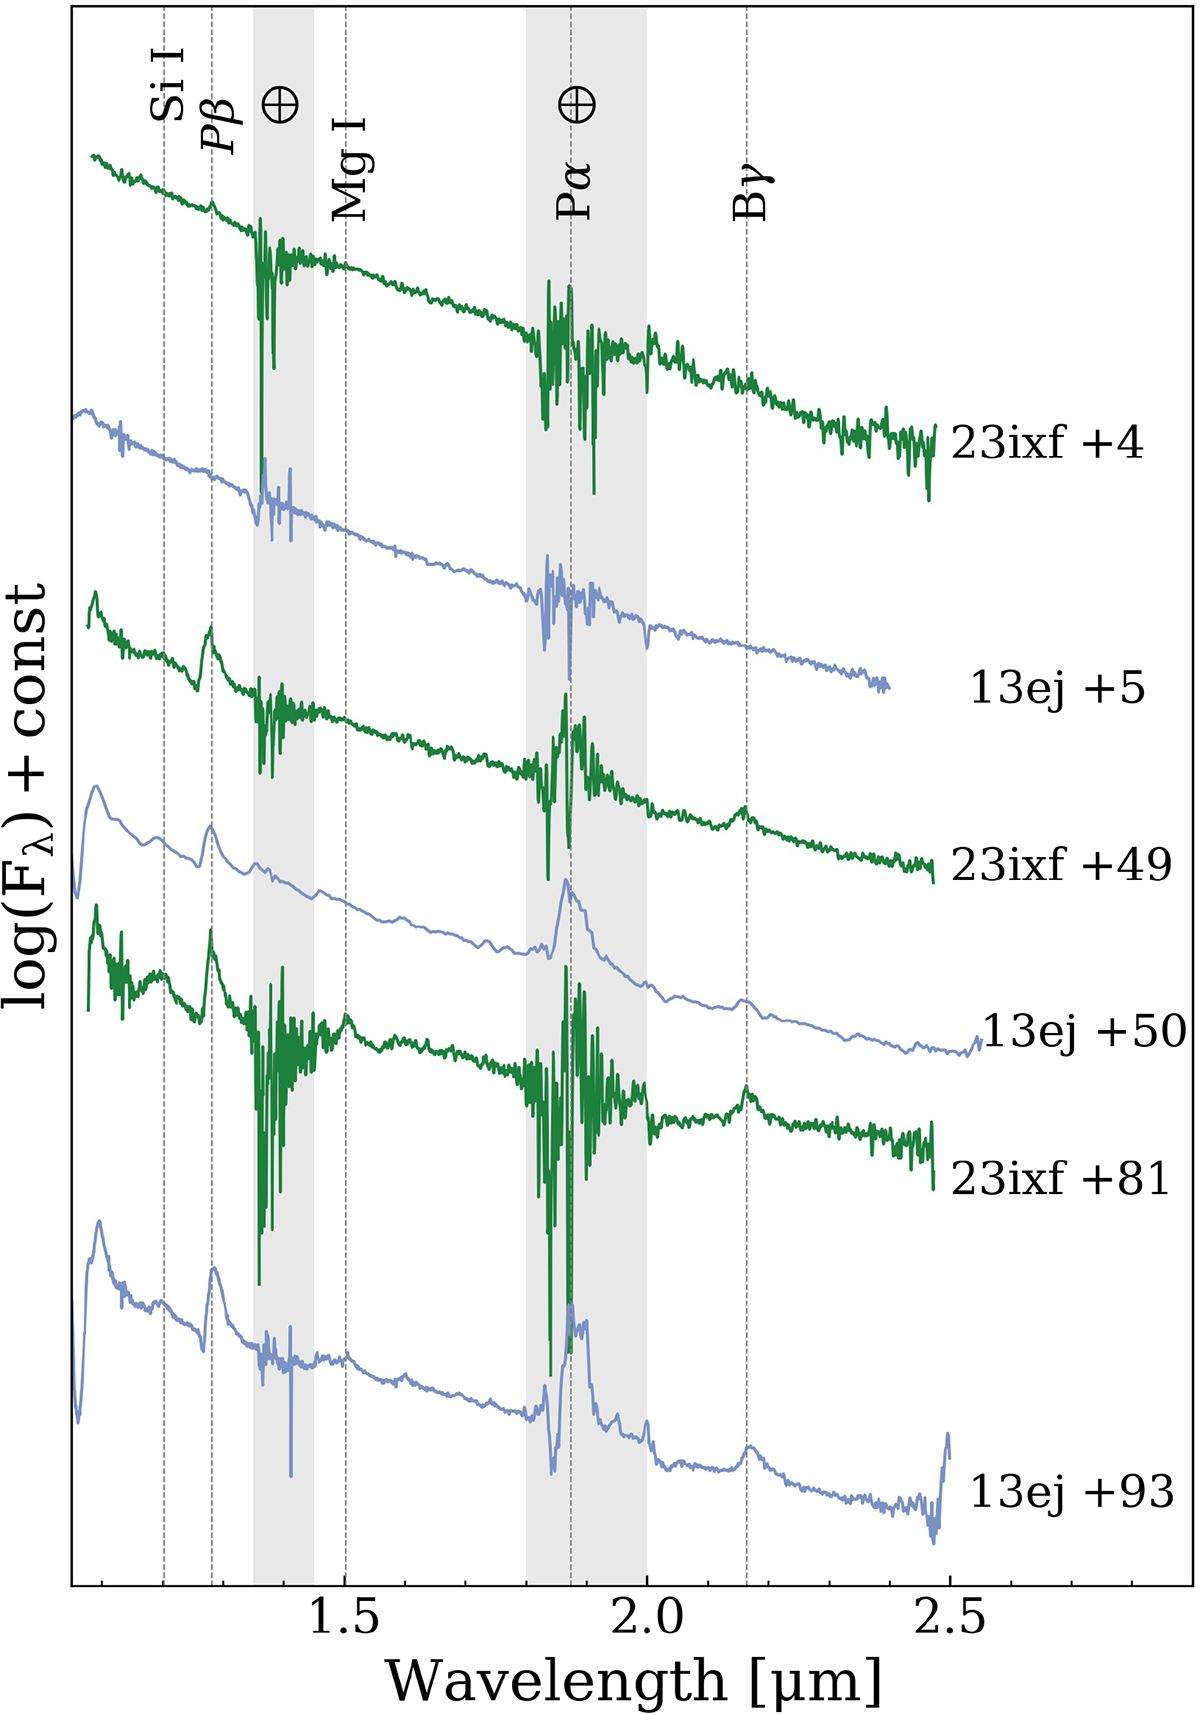
Comparison of the NIR spectra of SN 2023ixf with those of SN 2013ej at similar phases. Several prominent spectral features are marked by dashed lines, and telluric absorption is shown with crossed circles and gray shading.
Current usage metrics show cumulative count of Article Views (full-text article views including HTML views, PDF and ePub downloads, according to the available data) and Abstracts Views on Vision4Press platform.
Data correspond to usage on the plateform after 2015. The current usage metrics is available 48-96 hours after online publication and is updated daily on week days.
Initial download of the metrics may take a while.