Fig. A.1.
Download original image
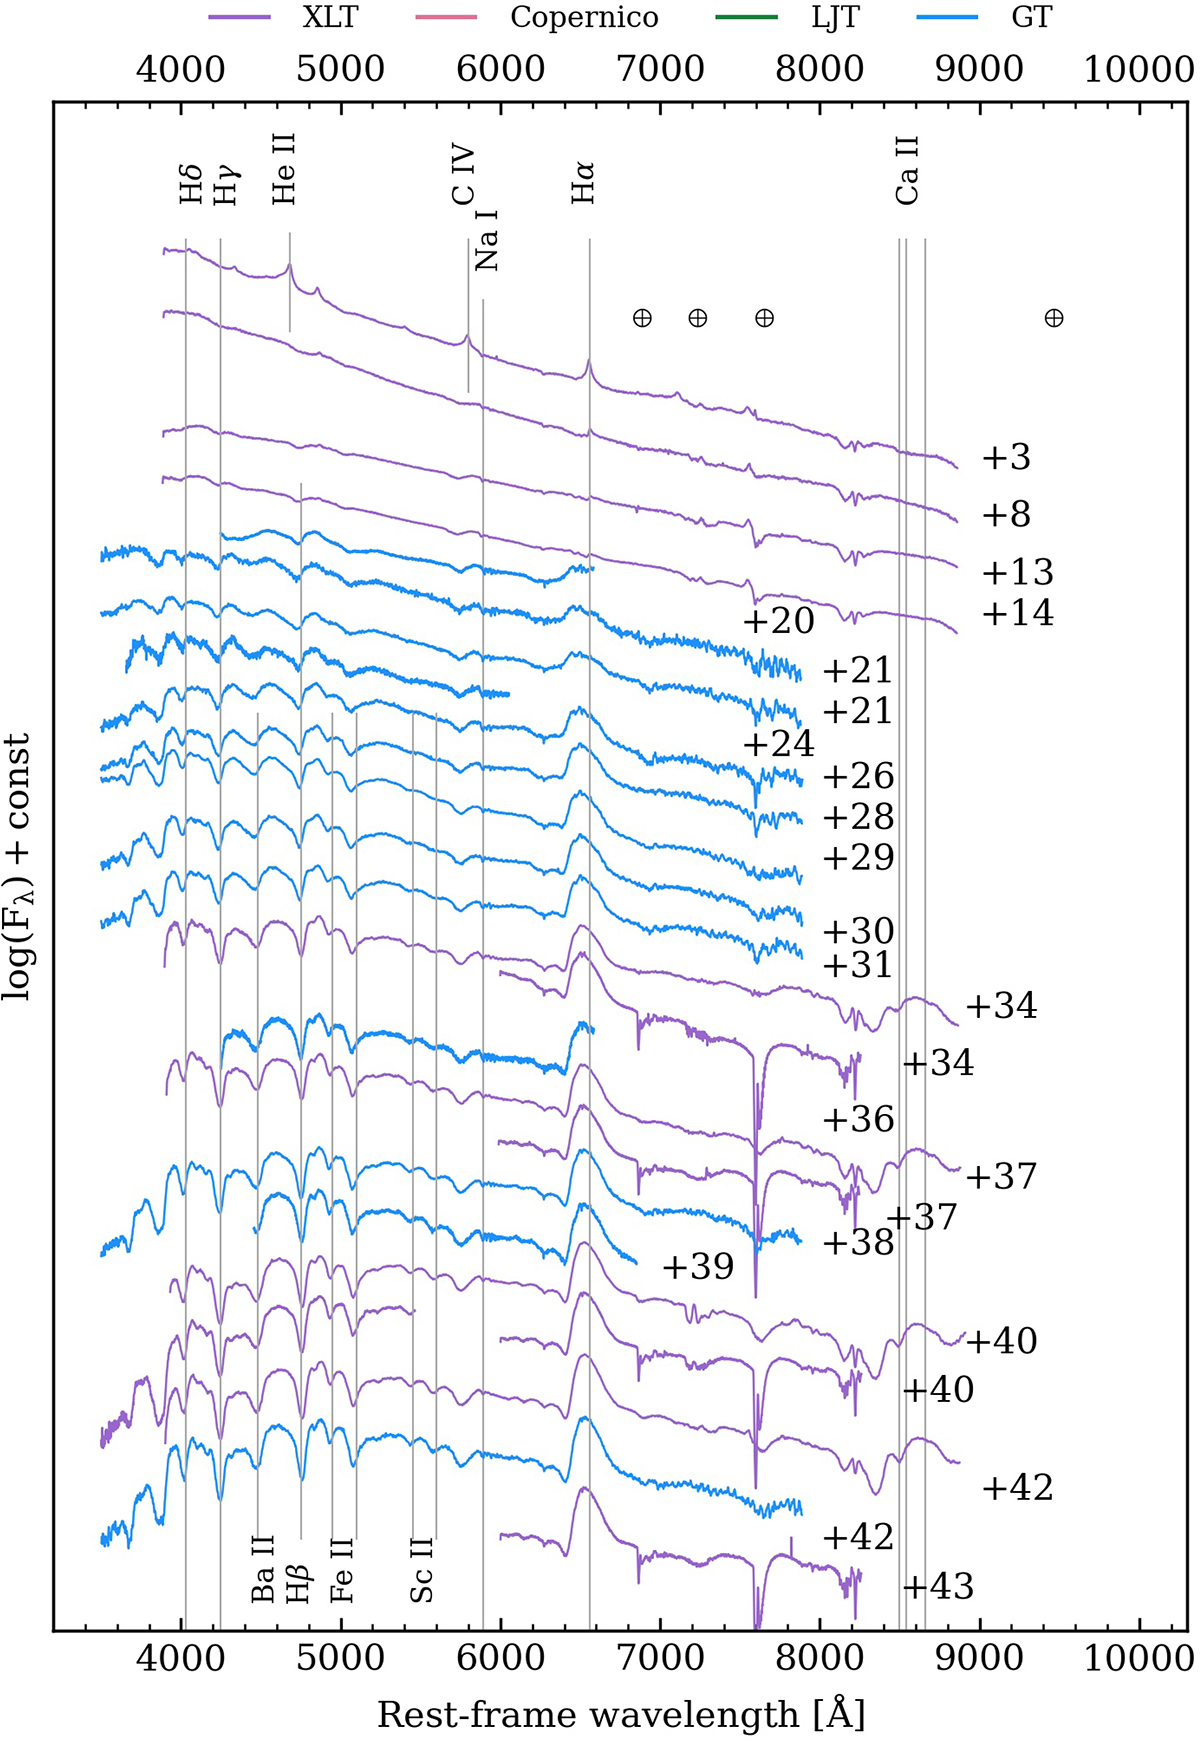
Spectral time series of SN 2023ixf spanning days 3 to 324. Observations conducted with different instruments are color coded and distinguished by the legend at the top. Phases are marked on the right. Some major telluric lines are identified by ⊕. Some noisy spectra are binned; the original version is plotted with a fainter color.
Current usage metrics show cumulative count of Article Views (full-text article views including HTML views, PDF and ePub downloads, according to the available data) and Abstracts Views on Vision4Press platform.
Data correspond to usage on the plateform after 2015. The current usage metrics is available 48-96 hours after online publication and is updated daily on week days.
Initial download of the metrics may take a while.