Open Access
Fig. B.1.
Download original image
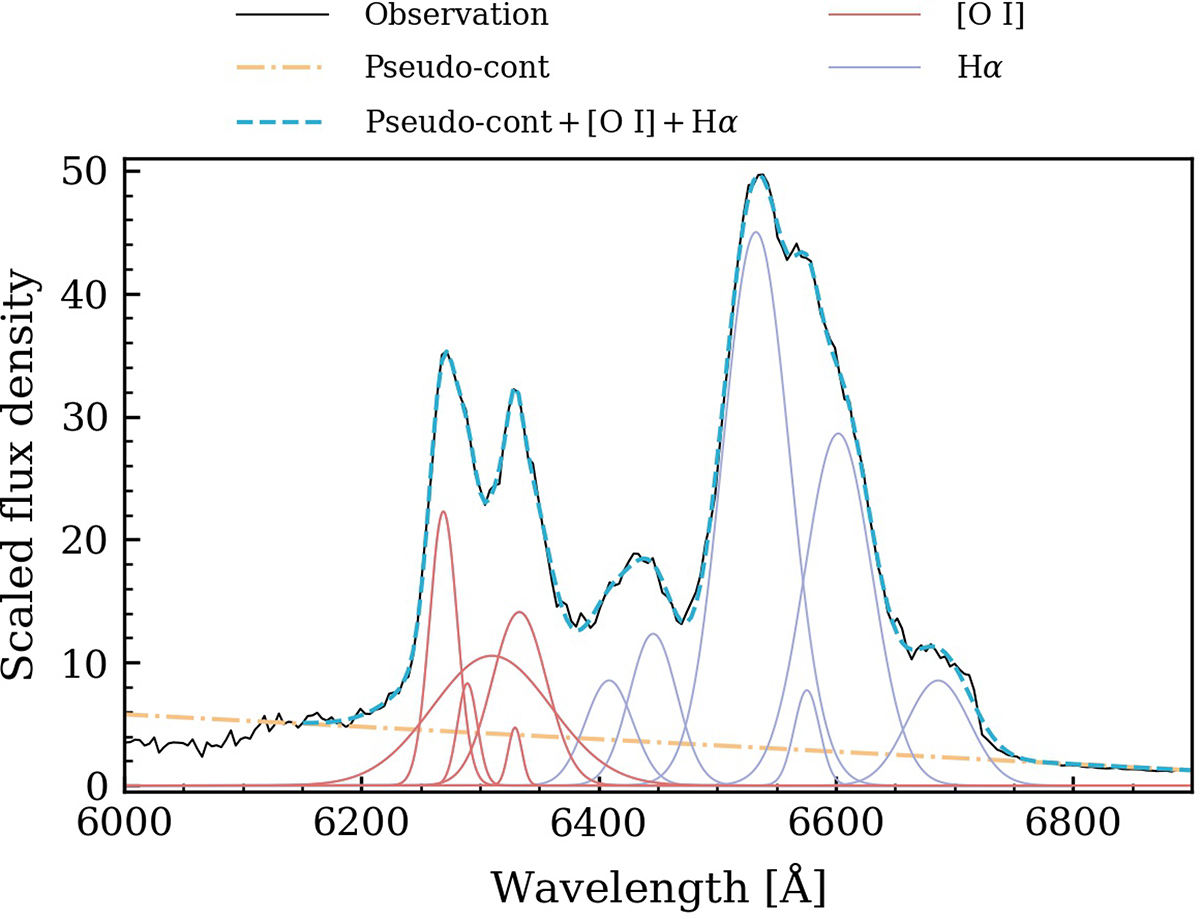
[O I] + Hα profile of SN 2023ixf at day 298. The observed spectrum (solid black line) is approximated by the dashed light blue line, which consists of a pseudo-continuum (dot-dashed orange line), five Gaussian components of [O I] (solid red lines), and five Gaussian components of Hα (solid dark blue lines).
Current usage metrics show cumulative count of Article Views (full-text article views including HTML views, PDF and ePub downloads, according to the available data) and Abstracts Views on Vision4Press platform.
Data correspond to usage on the plateform after 2015. The current usage metrics is available 48-96 hours after online publication and is updated daily on week days.
Initial download of the metrics may take a while.