Fig. 4.
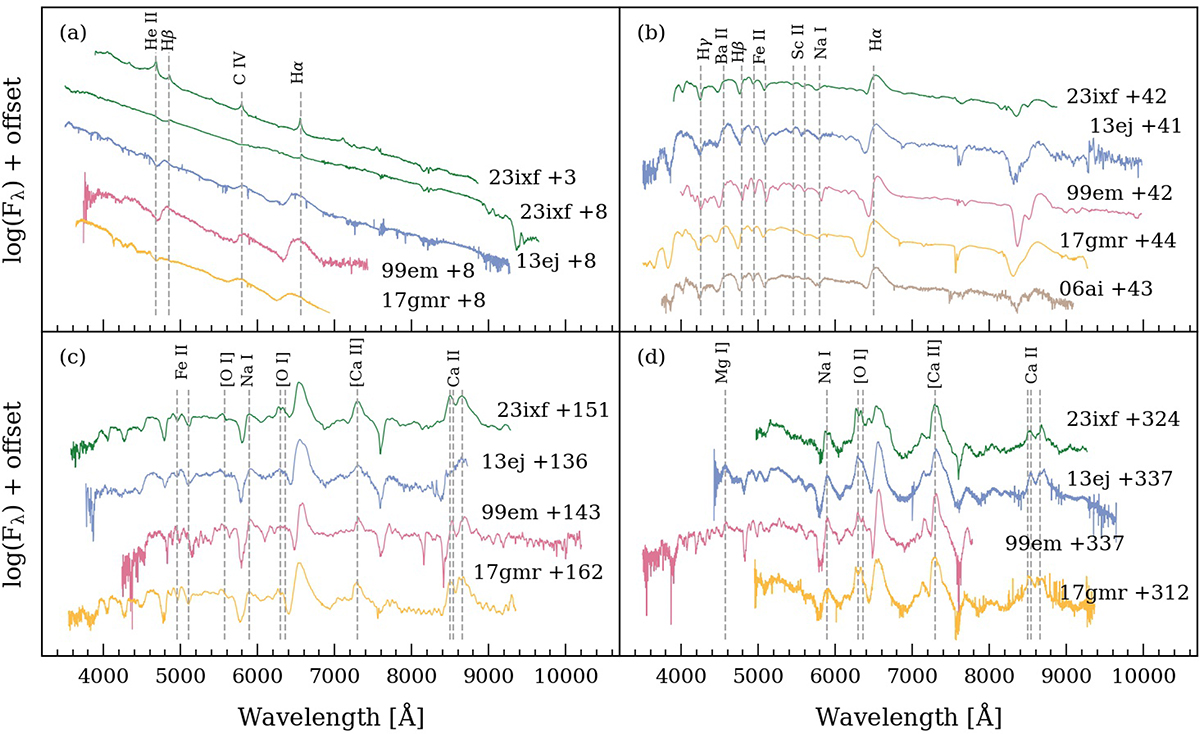
Download original image
Spectra of SN 2023ixf at days ∼5 (a), 40 (b), 150 (c), and 330 (d) compared to that of the Type IIP/L SNe 2013ej (Valenti et al. 2014; Yuan et al. 2016; Huang et al. 2015), 1999em (Leonard et al. 2002), 2017gmr (the spectrum at day 312 is binned; Andrews et al. 2019), and 2006ai (Hiramatsu et al. 2021) at similar phases. In each panel, major spectral features are marked by vertical dashed lines. For a better display, all spectra were shifted arbitrarily and presented in a logarithmic scale.
Current usage metrics show cumulative count of Article Views (full-text article views including HTML views, PDF and ePub downloads, according to the available data) and Abstracts Views on Vision4Press platform.
Data correspond to usage on the plateform after 2015. The current usage metrics is available 48-96 hours after online publication and is updated daily on week days.
Initial download of the metrics may take a while.