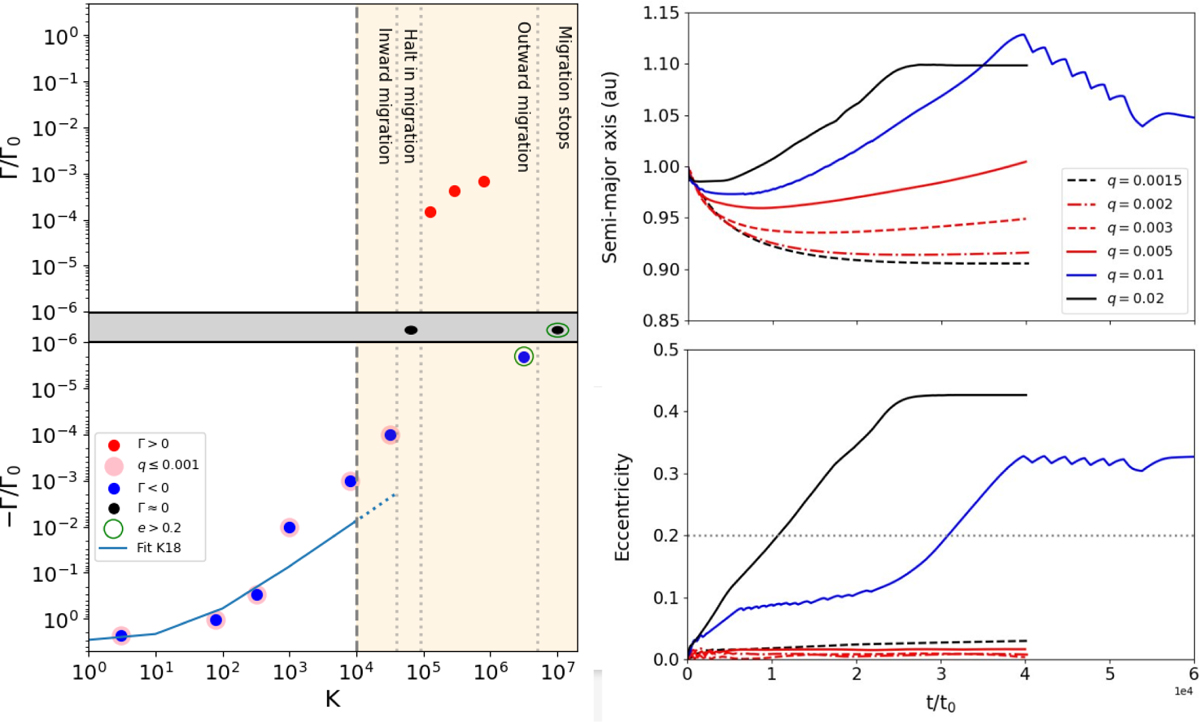
Fig. 2
Download original image
Left: normalised positives (red dots), negatives (blue and pink for q ≤ 1 × 10⁻³), and close to zero (black) torques as a function of a wide range of the K-parameter, including the previously studied domain by K18 (white background) and the new domain explored in this work (cream background), assuming α = 10−4, h0 = 0.05, s = 0.5, and Σ0 = 10−4. The fitting proposed by K18 in the K-range of their study (solid blue line) together with the potential extension in the new regime (dotted blue line) is given in Eq. (5). Torques exerted onto planets in orbits with e > 0.2 are highlighted (green circles). Four different migration regimes are marked indicating inward migration, a halt in migration, outward migration, and migration stalls (dotted grey lines). Right: evolution of the semi-major axis (top) and the eccentricity of the six planets that experience either outward migration or a halt in migration: q = 1.5 × 10⁻³ (dotted black line), q = 2 × 10⁻³ (dashed-dotted red line), q = 3 × 10⁻³ (dashed red line), q = 5 × 10⁻³ (solid red line), q = 1 × 10⁻² (solid blue line), and q = 2 × 10⁻² (solid black line). The value of eccentricity e = 0.2 that gives the change in the torques sign is overplotted (grey dotted line). The simulation for the planet with q = 0.01 was extended to allow eccentricity to settle.
Current usage metrics show cumulative count of Article Views (full-text article views including HTML views, PDF and ePub downloads, according to the available data) and Abstracts Views on Vision4Press platform.
Data correspond to usage on the plateform after 2015. The current usage metrics is available 48-96 hours after online publication and is updated daily on week days.
Initial download of the metrics may take a while.