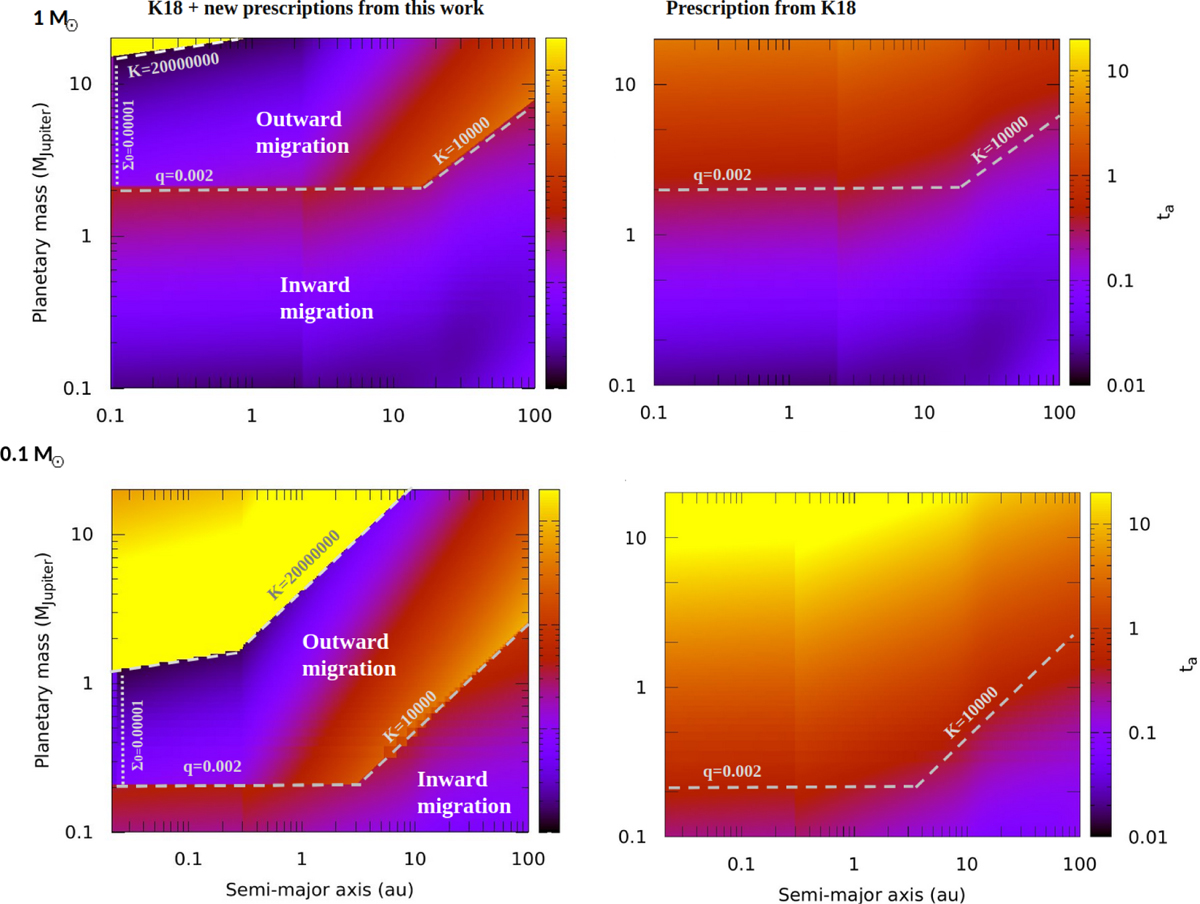
Fig. 7
Download original image
Maps of semi-major axis evolution timescale for different planetary masses and semi-major axis for a 1 M⊙ star (top) and for a 0.1 M⊙ star (bottom), assuming a low-viscosity disc (α = 10−4) with gas surface density and aspect ratio profiles described in Eqs. (1) and (2), assuming s = 0.5 (f = 0) in the inner disc and s = 1 (f = 0.25) in the outer disc. The transition was set at rtrans = 0.3 au for M★ = 0.1 M⊙, and at rtrans = 2 au for M★ = 1 M⊙. We assumed r0 = rtran, and characterised both the inner and outer disc by Σ0 = 4 × 10⁻⁴ M⊙/au2 and h0 = 0.03, simulating the conditions of a disc at 1–2 Myr with a high gas disc mass ~10% M★. Limits for inward and outward migration are overplotted (dashed grey lines). Right: timescales calculated applying only the fitting function from K18 (see Eq. (5)). Left: timescales calculated combining the fitting function from K18 for K < 104 and q < 0.002, and the fitting functions propose in this work (see Eq. (6)), for 0.002 < q < 0.02 and K < 2 × 10⁷, relating the surface density Σ(r) to Σ0 = 10−5 M★/r2 (dotted grey line).
Current usage metrics show cumulative count of Article Views (full-text article views including HTML views, PDF and ePub downloads, according to the available data) and Abstracts Views on Vision4Press platform.
Data correspond to usage on the plateform after 2015. The current usage metrics is available 48-96 hours after online publication and is updated daily on week days.
Initial download of the metrics may take a while.