Fig. 1.
Download original image
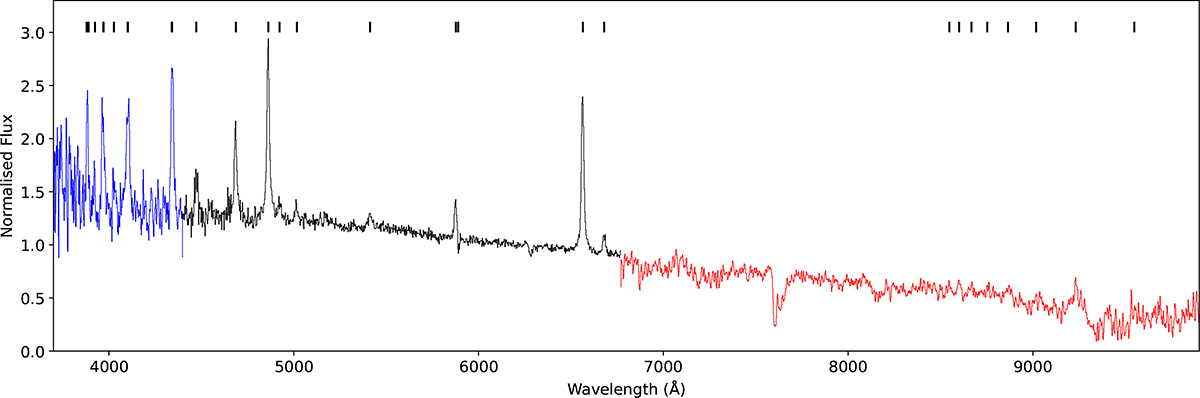
Stacked spectrum using all exposures in all grisms. The blue section represents the grism 18 observation, the black spectrum the weighted mean of the 40 grism 19 spectra, and the red section represents the grism 20 spectrum. The positions of emission lines from H I, He I, and He II are indicated with vertical lines at the top. Some of the hydrogen lines in the grism 20 spectrum are only tentatively detected. We also mark the position of NaD absorption, which is presumably interstellar in nature. The spectrum has been normalised to 1 at 6000 Å.
Current usage metrics show cumulative count of Article Views (full-text article views including HTML views, PDF and ePub downloads, according to the available data) and Abstracts Views on Vision4Press platform.
Data correspond to usage on the plateform after 2015. The current usage metrics is available 48-96 hours after online publication and is updated daily on week days.
Initial download of the metrics may take a while.