Open Access
Fig. 3.
Download original image
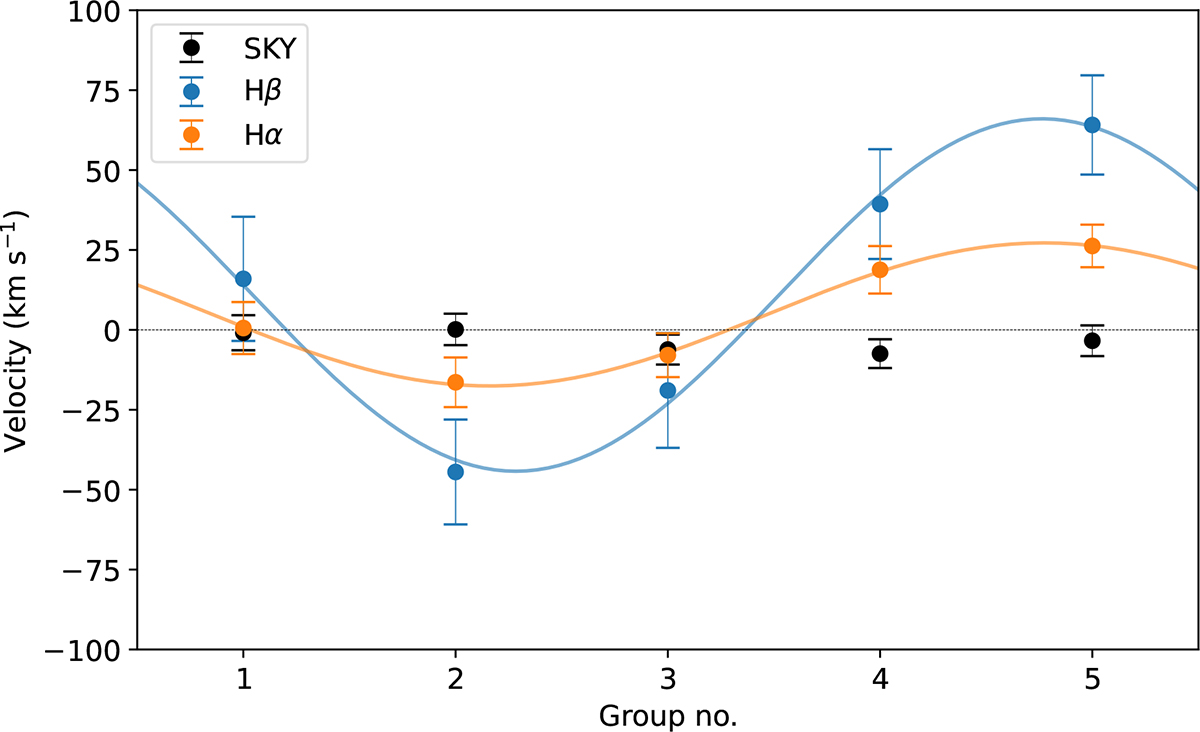
Velocities derived from Doppler shifts measured from the Hα and Hβ lines covering the full phase of the 12.37 min variability period (see Fig. 2). Sine curves have been fitted to the Hα and Hβ data points to highlight their periodic nature. For comparison, we also show velocities measured from sky-lines in the same spectra.
Current usage metrics show cumulative count of Article Views (full-text article views including HTML views, PDF and ePub downloads, according to the available data) and Abstracts Views on Vision4Press platform.
Data correspond to usage on the plateform after 2015. The current usage metrics is available 48-96 hours after online publication and is updated daily on week days.
Initial download of the metrics may take a while.