Fig. 6.
Download original image
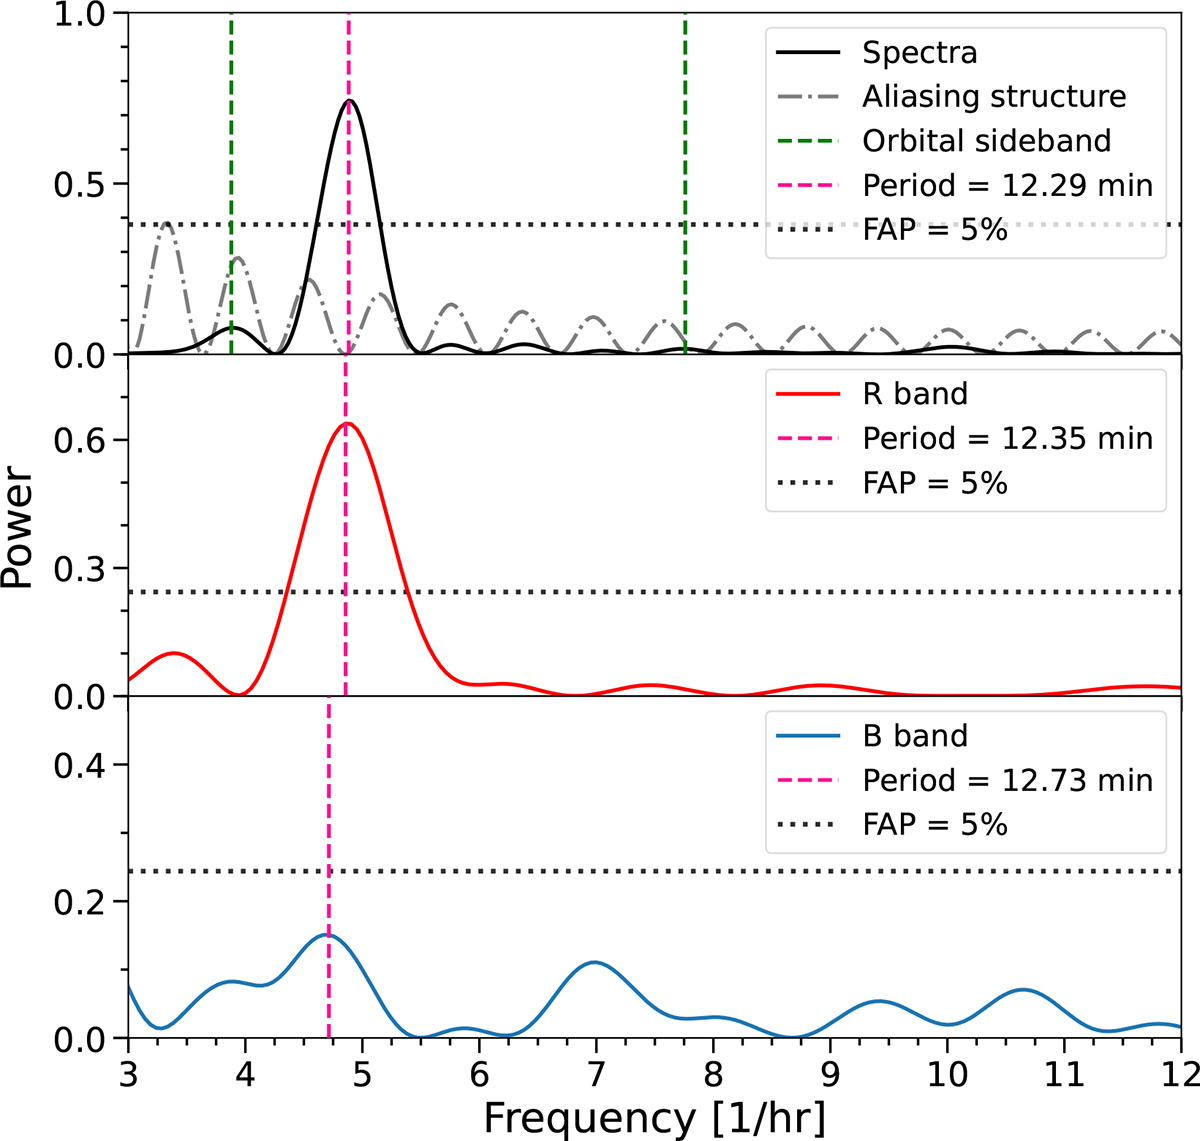
Normalised FFT power spectra of the integrated fluxes seen in Fig. 4, along with the R and B band photometry measurements. The fluxes have been normalised in terms of the maximum flux. An oversampling factor of 20 has been used to get better frequency resolution in all three power spectra. The aliasing structure resulting from the spectral window of the observations for grism 19 is shown in the top panel, along with the potential orbital sidebands. The aliasing structure has been scaled by the same factor as the normalised power spectrum. A detection threshold corresponding to a 5% FAP has been calculated for each spectrum.
Current usage metrics show cumulative count of Article Views (full-text article views including HTML views, PDF and ePub downloads, according to the available data) and Abstracts Views on Vision4Press platform.
Data correspond to usage on the plateform after 2015. The current usage metrics is available 48-96 hours after online publication and is updated daily on week days.
Initial download of the metrics may take a while.