Fig. 7.
Download original image
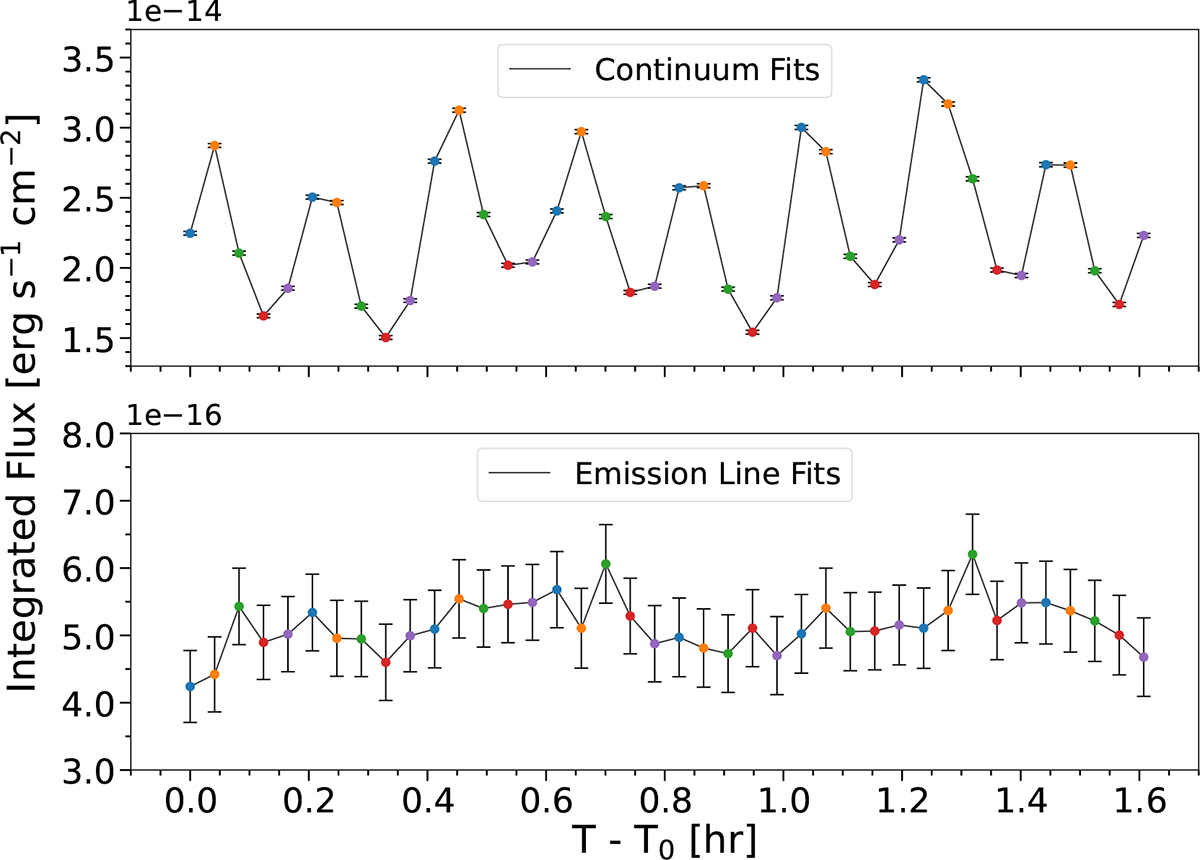
Top: Estimated integrated fluxes for the continuum, which has been obtained by fitting a polynomial to the parts of the spectra, without emission lines. Bottom: Estimated integrated fluxes for the He II, Hβ, He I and Hα emission lines, obtained from the spectra by subtracting the continuum and fitting Gaussian functions to each of the four lines.
Current usage metrics show cumulative count of Article Views (full-text article views including HTML views, PDF and ePub downloads, according to the available data) and Abstracts Views on Vision4Press platform.
Data correspond to usage on the plateform after 2015. The current usage metrics is available 48-96 hours after online publication and is updated daily on week days.
Initial download of the metrics may take a while.