Fig. 1
Download original image
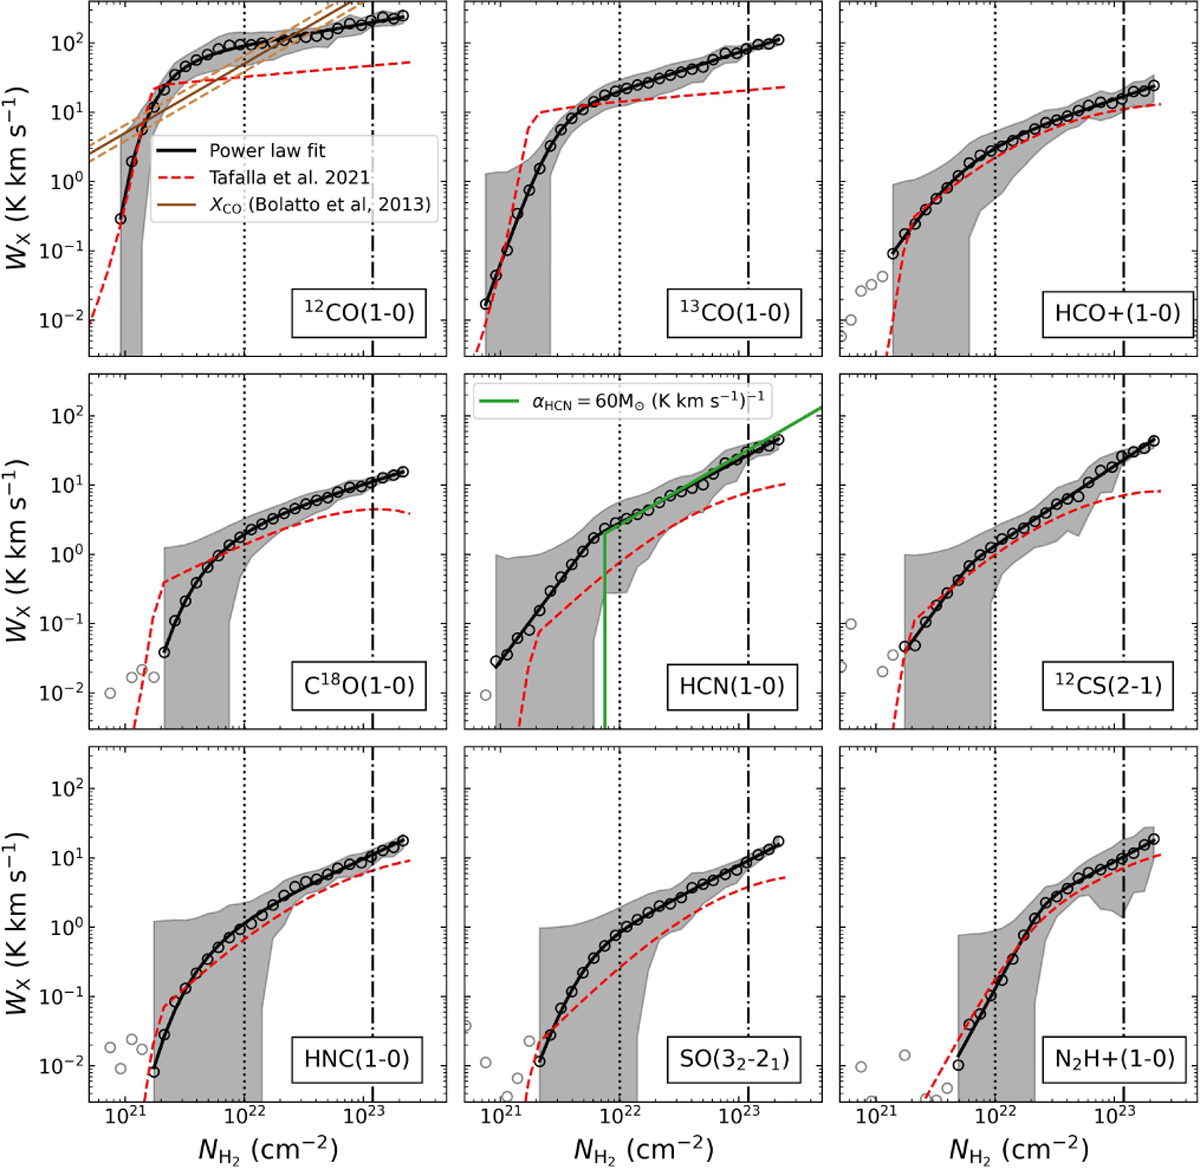
Binned trends of line integrated intensity as a function of column density. The data are binned in 30 equally sized bins of column density. Black circles correspond to the bin average, while the grey shading indicates the standard deviation in each bin. The solid black line is a smoothly varying double PL fit to the trends, specific to each emission line. The dashed red line shows, for comparison, the empirical fit to the Perseus cloud by Tafalla et al. (2021), assuming a kinetic temperature of 11 K. Each panel shows a different emission line: 12CO(J = 1 → 0), 13CO(J = 1 → 0) and HCO+(J = 1 → 0) (left to right, top row); C18O(J =1 → 0), HCN(J =1 → 0) and 12CS(J = 2 → 1) (middle); HNC(J = 1 → 0), SO(JK = 32 → 21) and N2H+(J = 1 → 0) (bottom). The standard Milky Way CO-to-H2 conversion factor and its typical uncertainty (Bolatto et al. 2013) is indicated in the top left panel. An HCN( J = 1 → 0) dense gas conversion factor of 60 M⊙ (K km s−1)−1 is indicated in the central panel as the green curve.
Current usage metrics show cumulative count of Article Views (full-text article views including HTML views, PDF and ePub downloads, according to the available data) and Abstracts Views on Vision4Press platform.
Data correspond to usage on the plateform after 2015. The current usage metrics is available 48-96 hours after online publication and is updated daily on week days.
Initial download of the metrics may take a while.