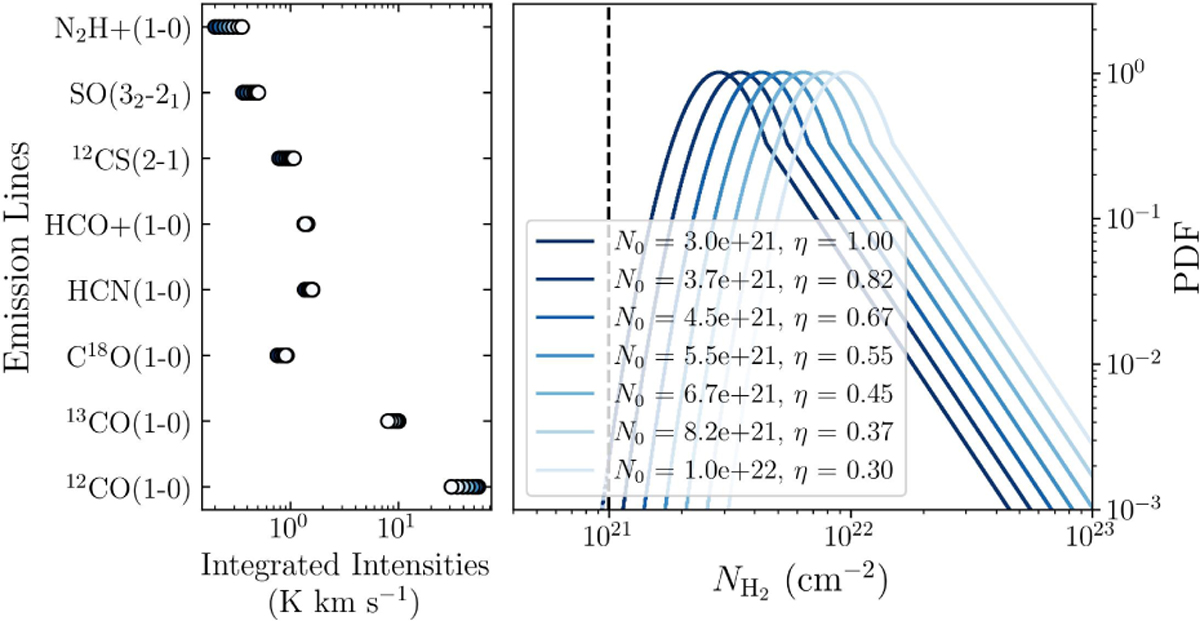
Fig. A.4
Download original image
Left : same as Figure A.1, except for N0 increasing from 3 × 1021 cm−2 to 1 × 1022 cm−2, η decreasing from 1 to 0.3 and σ = 0.3. The predicted integrated intensities vary by 10% to 50% at most (30% on average), which illustrates the degeneracy between the LN mean N0 and the pixel area filling factor η. The right panel displays the corresponding N-PDF with varying N0.
Current usage metrics show cumulative count of Article Views (full-text article views including HTML views, PDF and ePub downloads, according to the available data) and Abstracts Views on Vision4Press platform.
Data correspond to usage on the plateform after 2015. The current usage metrics is available 48-96 hours after online publication and is updated daily on week days.
Initial download of the metrics may take a while.