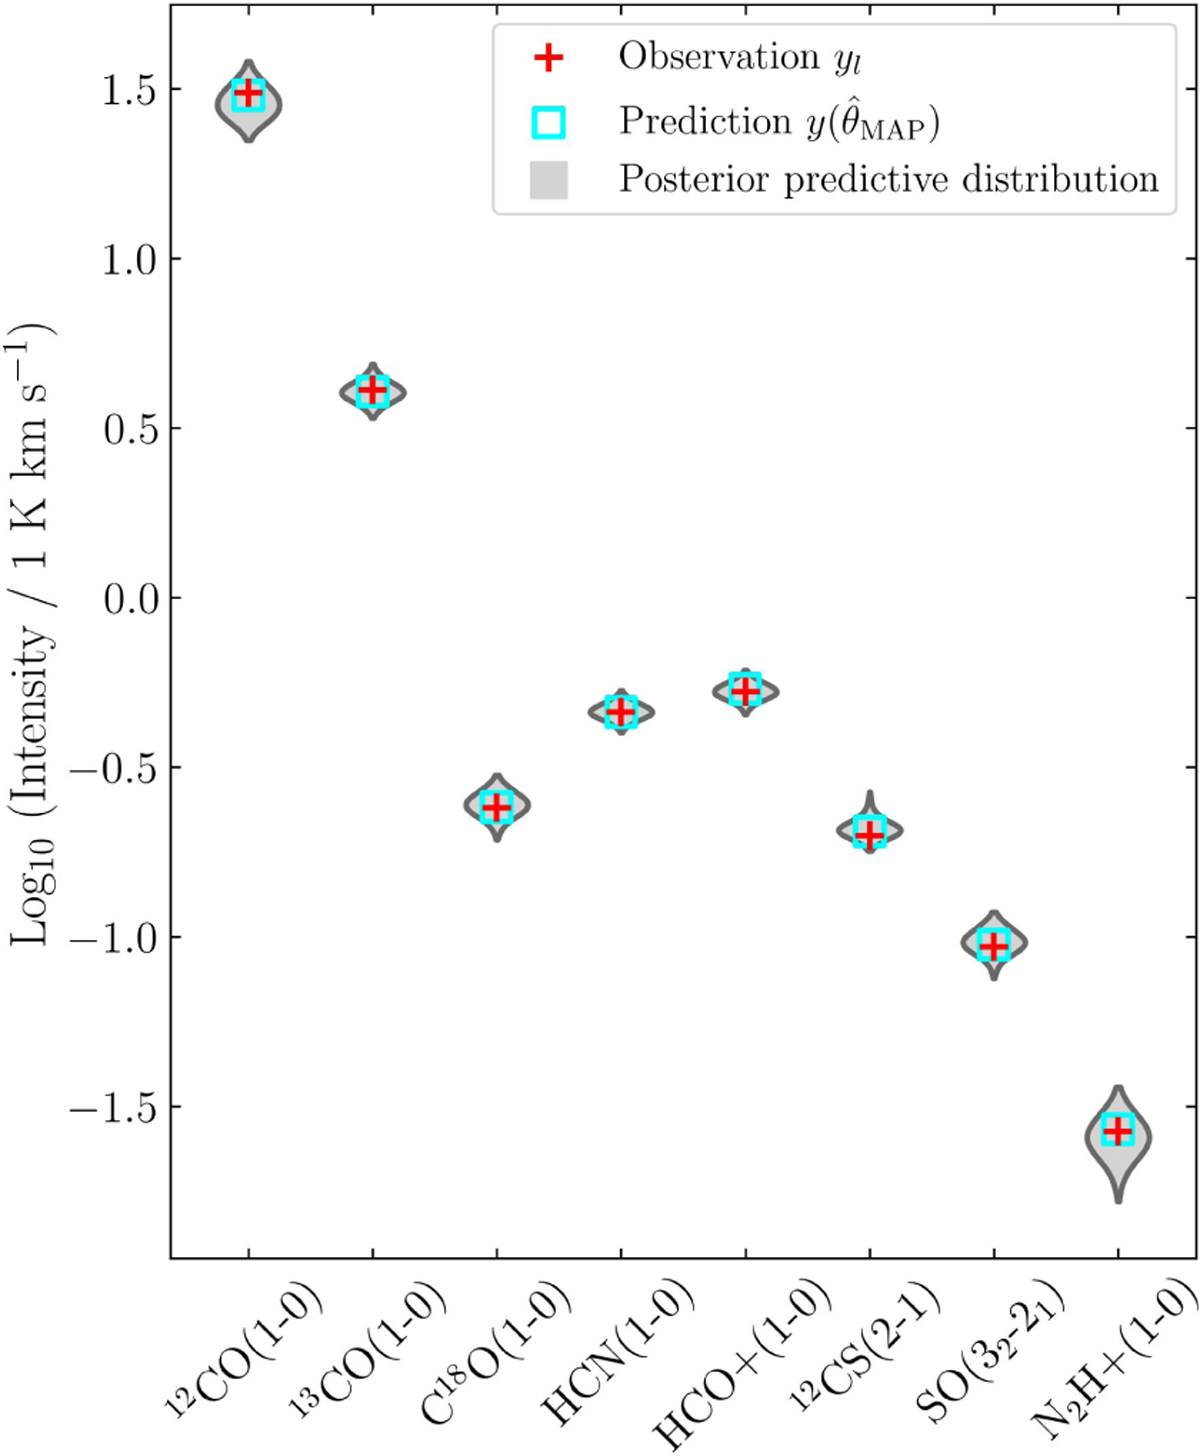
Fig. B.1
Download original image
Posterior predictive distribution from the Bayesian inversion on the Orion B data performed in Section 5. The red crosses show the observed intensity, the cyan squares show the model prediction for the MAP estimator and the grey violin plot shows the histogram of model predictions for the entire posterior PDF (every MCMC iteration).
Current usage metrics show cumulative count of Article Views (full-text article views including HTML views, PDF and ePub downloads, according to the available data) and Abstracts Views on Vision4Press platform.
Data correspond to usage on the plateform after 2015. The current usage metrics is available 48-96 hours after online publication and is updated daily on week days.
Initial download of the metrics may take a while.