Fig. C.1
Download original image
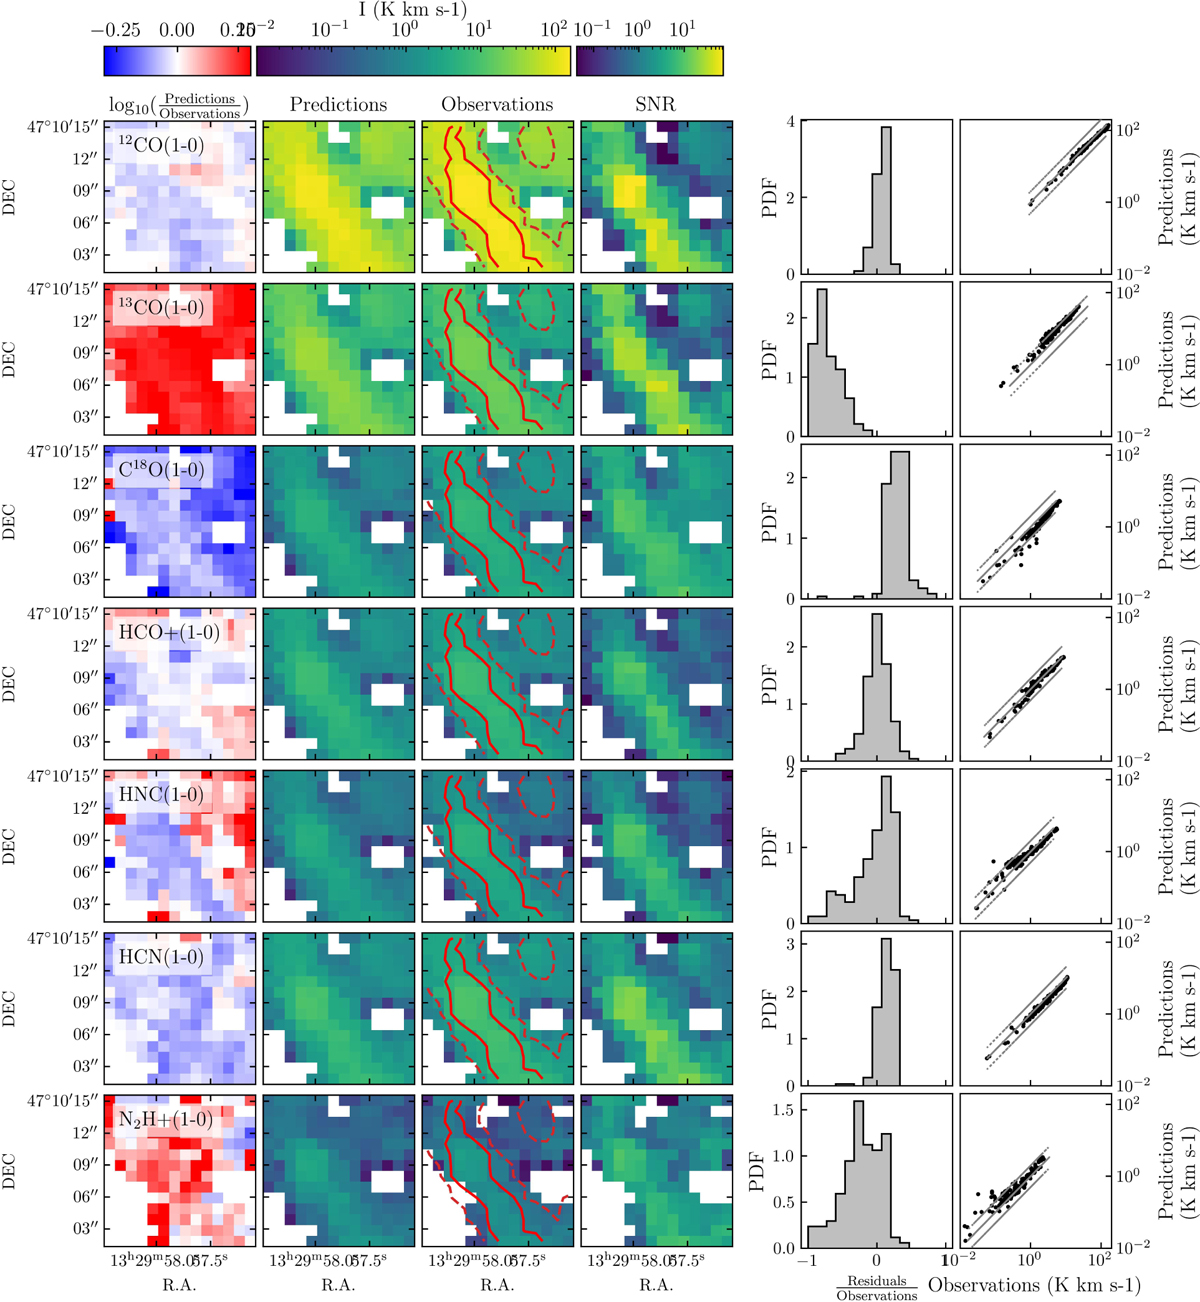
From the leftmost to the rightmost column: ratio of best model prediction over observed integrated intensities (in log10 scale, the colour scale limits are a factor of two in red and a factor 0.5 in blue), best model predictions, observations, S/N level, histograms of the residuals normalised by the observations and finally best model prediction as a function of observations. For the observation column, red contours in each panel indicate 13CO(J = 1 → 0) integrated intensities of 4 and 12 K km s−1 (dashed and solid contours, respectively). Each row is a different emission line, from top to bottom: 12CO(J = 1 → 0), 13CO(J = 1 → 0), C18O(J = 1 → 0), HCO+(J = 1 → 0), HNC(J = 1 → 0), HCN(J = 1 → 0) and N2H+(J = 1 → 0).
Current usage metrics show cumulative count of Article Views (full-text article views including HTML views, PDF and ePub downloads, according to the available data) and Abstracts Views on Vision4Press platform.
Data correspond to usage on the plateform after 2015. The current usage metrics is available 48-96 hours after online publication and is updated daily on week days.
Initial download of the metrics may take a while.