Fig. D.1
Download original image
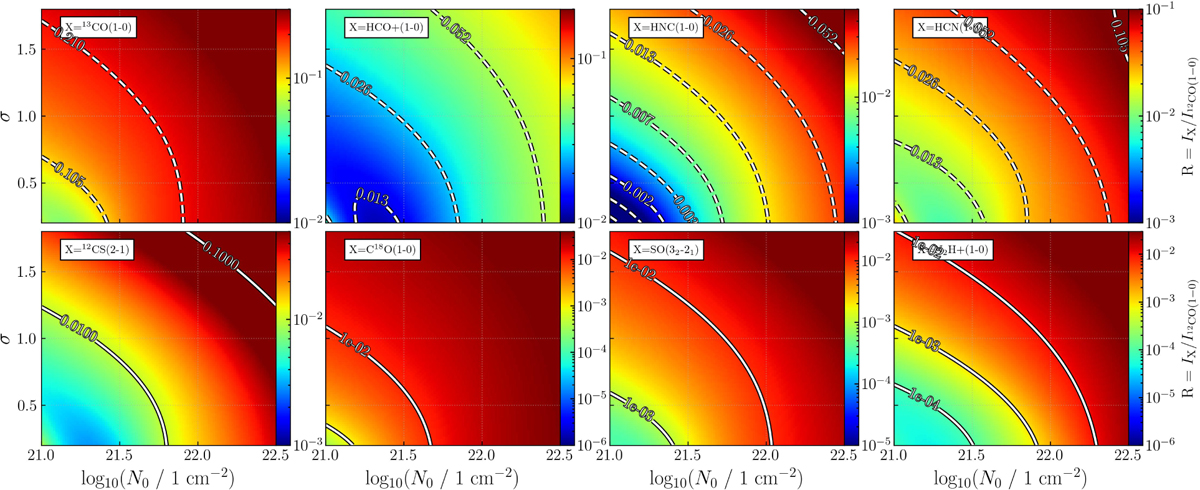
Model predicted line integrated intensities ratios over 12CO( J =1 → 0) as a function σ and N0 for a purely LN N-PDF. Top row shows the ratios of 13CO(J =1 → 0), HCO+ (J =1 → 0), HNC(J =1 → 0) and HCN( J =1 → 0) over 12CO(J =1 → 0), from left to right. In this top row dashed lines show ratio isocontours increasing by factors of two. Bottom row shows the ratios of12CS( J = 2 → 1), C18O( J = 1 → 0), SO(JK = 32 → 21 ) and N2H+ (J = 1 → 0) over 12CO(J = 1 → 0), from left to right. In the bottom row isocontours represent factors of tens.
Current usage metrics show cumulative count of Article Views (full-text article views including HTML views, PDF and ePub downloads, according to the available data) and Abstracts Views on Vision4Press platform.
Data correspond to usage on the plateform after 2015. The current usage metrics is available 48-96 hours after online publication and is updated daily on week days.
Initial download of the metrics may take a while.