Fig. 2
Download original image
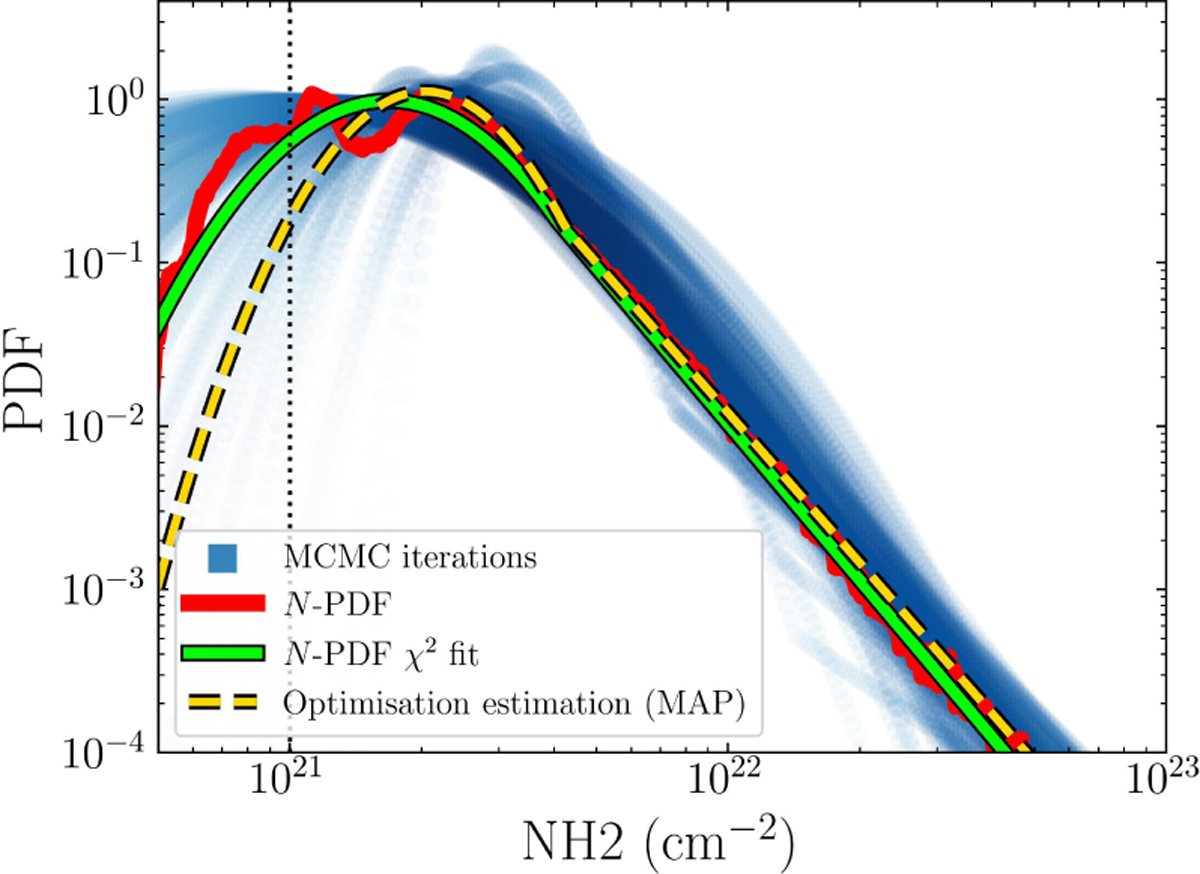
Comparison of the reference and estimated N-PDFs when inverting the N-PDF on the spatially and spectrally averaged ORION-B data. The thick red line indicates the N-PDF as a histogram constructed directly from the dust-derived Orion B column densities, and the green line represents a χ2 fit to the red histogram. The estimated N-PDFs from the 10 000 MCMC iterations to sample the Bayesian posterior are shown with blue circles. The dashed orange line is the MAP estimation for the N-PDF. The vertical dotted black line indicates the limit below which the line intensities predicted by the emission function fall below the typical noise level of the data, that is, 0.1 K km s−1.
Current usage metrics show cumulative count of Article Views (full-text article views including HTML views, PDF and ePub downloads, according to the available data) and Abstracts Views on Vision4Press platform.
Data correspond to usage on the plateform after 2015. The current usage metrics is available 48-96 hours after online publication and is updated daily on week days.
Initial download of the metrics may take a while.