Fig. 3
Download original image
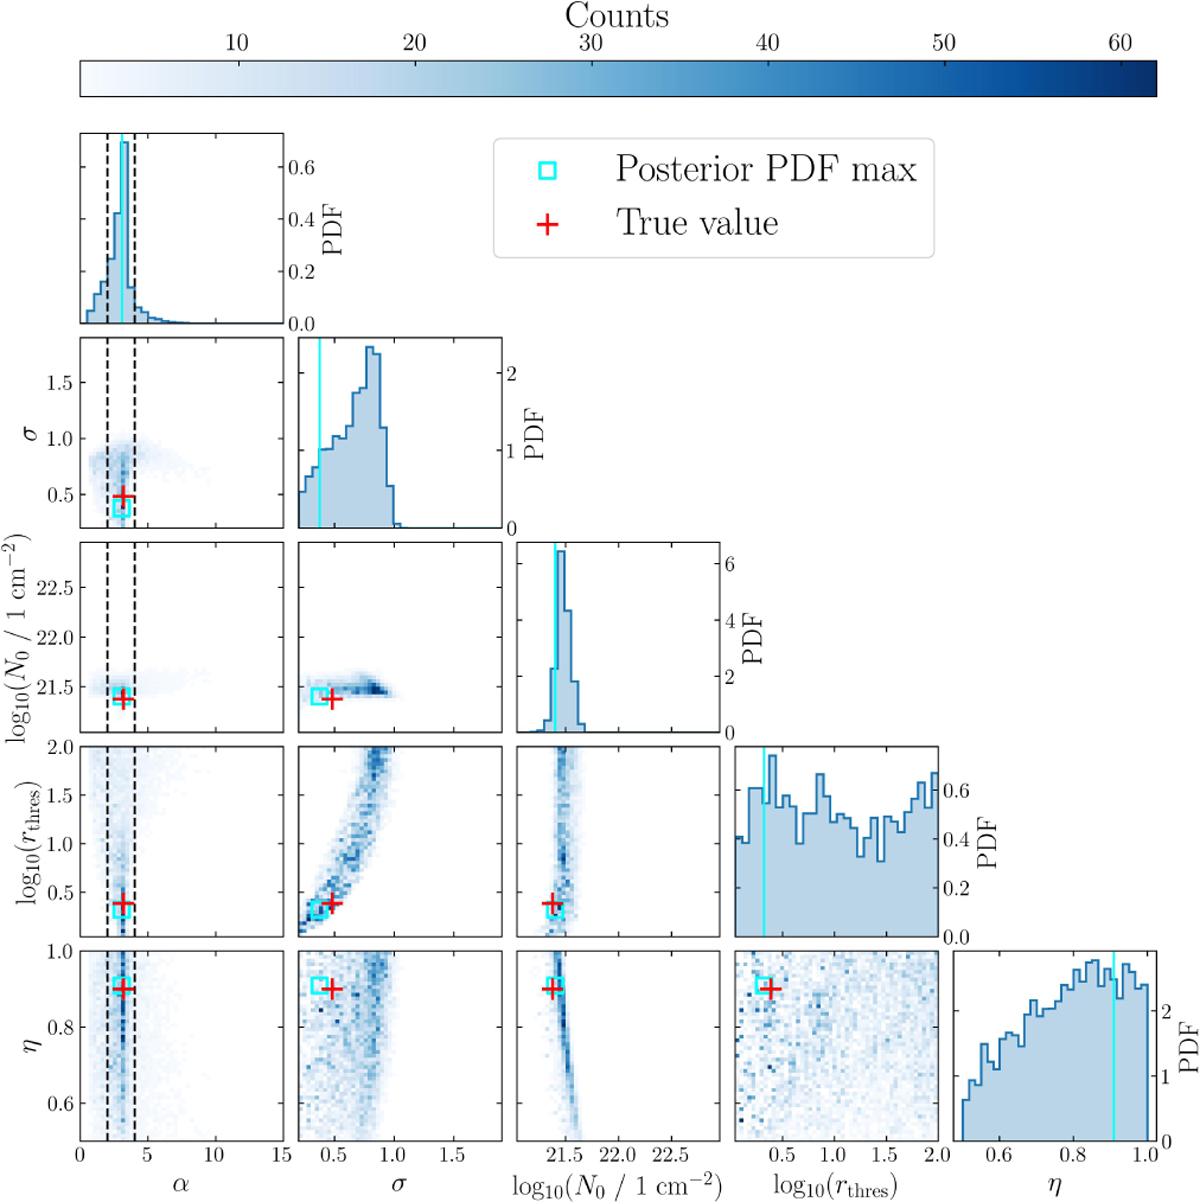
Two-dimensional projections of the posterior PDF in the form of a scatter plot matrix. The matrix’s diagonal shows the posterior PDF of each estimated parameter. The MAP estimation is represented as a vertical cyan line on the histograms and as a cyan square in the scatter plot. The true N-PDF parameters obtained by fitting the dust-derived Orion B N -PDF are shown as red crosses. The dashed black line shows the range in PL index α of the N-PDF expected for gravitational collapse. The estimations closely match the reference values, although clear degeneracies are present in the posterior PDF.
Current usage metrics show cumulative count of Article Views (full-text article views including HTML views, PDF and ePub downloads, according to the available data) and Abstracts Views on Vision4Press platform.
Data correspond to usage on the plateform after 2015. The current usage metrics is available 48-96 hours after online publication and is updated daily on week days.
Initial download of the metrics may take a while.