Fig. 4
Download original image
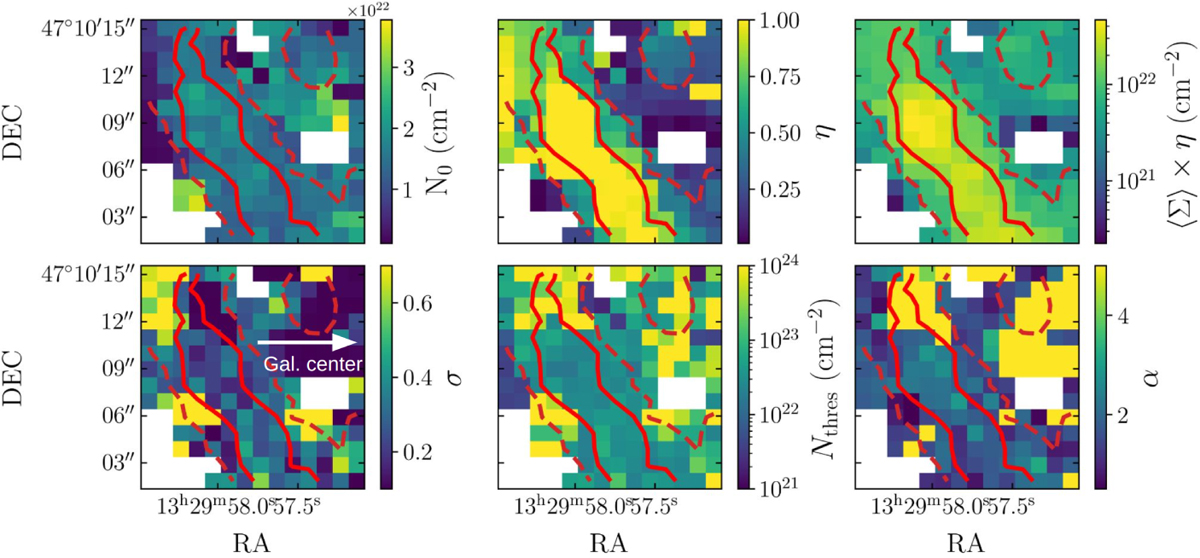
MAP estimations of the sub-beam N-PDF parameters across our M51 test region. Top, from left to right : mean column density of the LN part of N-PDF (N0 ), the pixel area filling factor (η) and the average gas density (including blank sky contributions). Bottom : width of the LN (σ), the column density of transition between the LN and PL parts of the N-PDF (Nthresh) and the PL index (α). Red contours in each panel indicate 13CO(J = 1 → 0) integrated intensities of 4 and 12 K km s−1 (dashed and solid contours, respectively). The white arrow indicates the direction to the galactic centre. To first order, the gas is denser and more gravitationally unstable inside the spiral arm than outside it.
Current usage metrics show cumulative count of Article Views (full-text article views including HTML views, PDF and ePub downloads, according to the available data) and Abstracts Views on Vision4Press platform.
Data correspond to usage on the plateform after 2015. The current usage metrics is available 48-96 hours after online publication and is updated daily on week days.
Initial download of the metrics may take a while.