Fig. 5
Download original image
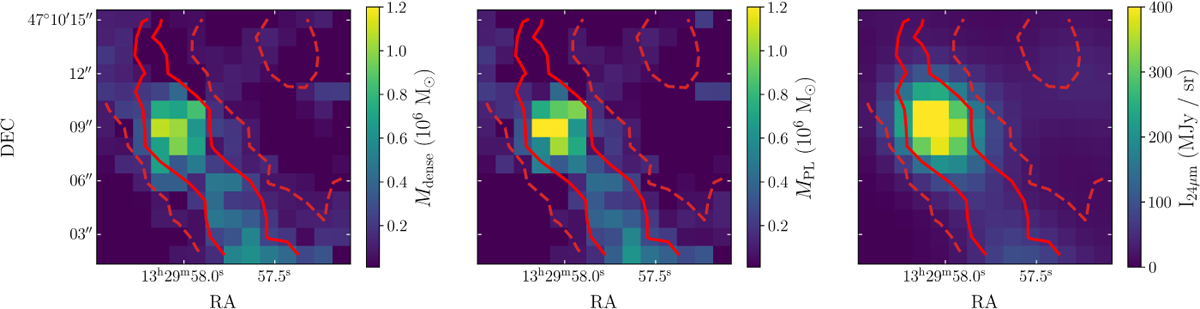
Spatial distribution of the mass of dense gas (left), the gas mass in the PL part of the N-PDF (middle) and the 24 μm surface brightness in our M51 target region. We use the 24 μm emission as a proxy for star formation. The masses are derived from the MAP estimate of the N-PDF, using Eqs. (12) and (11). The red contours are the same as in Figure 4. The masses of dense and PL gas appear highly correlated, with a similar spatial distribution as the 24 μm emission.
Current usage metrics show cumulative count of Article Views (full-text article views including HTML views, PDF and ePub downloads, according to the available data) and Abstracts Views on Vision4Press platform.
Data correspond to usage on the plateform after 2015. The current usage metrics is available 48-96 hours after online publication and is updated daily on week days.
Initial download of the metrics may take a while.