Fig. 6
Download original image
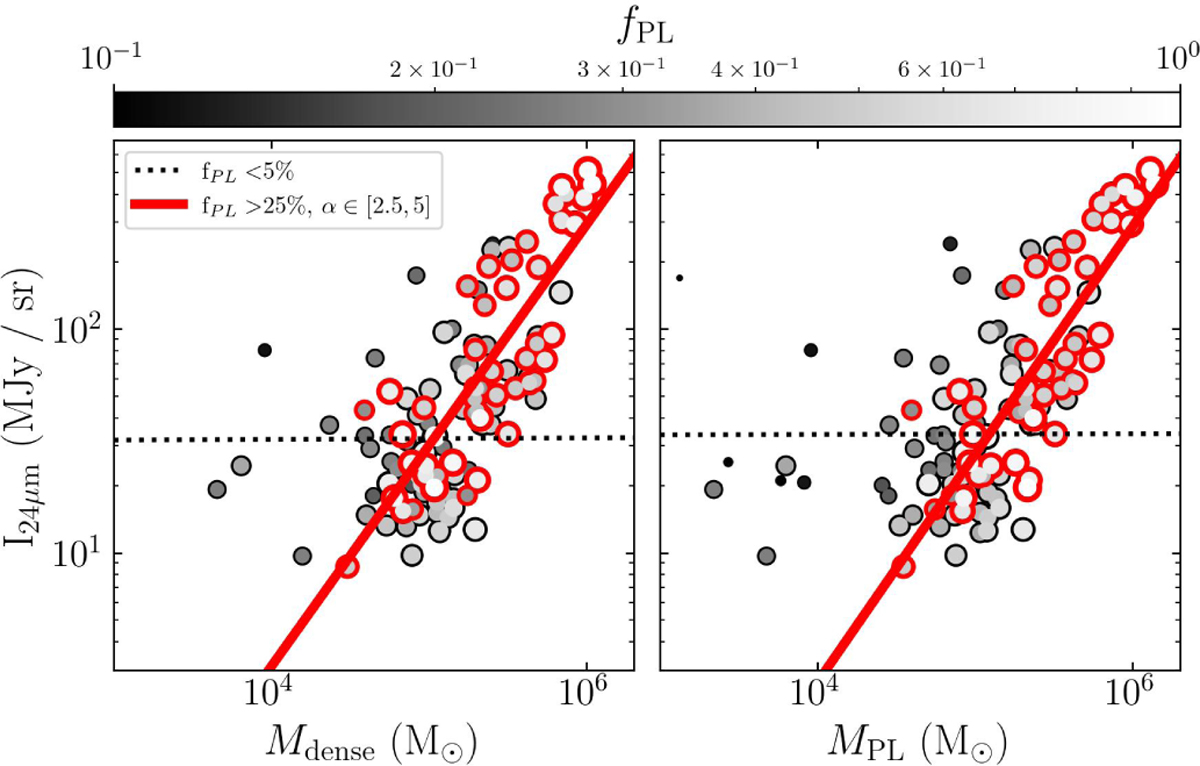
Correlation between the 24 μm integrated intensity and: the mass of dense gas (left) and the mass of gas in the PL part of the N-PDF (right) for pixels within our M51 test region. Each data point corresponds to a pixel within our field. The symbol size and grey shading represent fPL, the mass fraction of the gas in the PL part of the N-PDF. Symbols with a red outline identify pixels where fPL ≥ 25% and the slope of the PL α ∈ [2.5,5]. The dotted line is a linear fit to the pixels where fPL < 5%. The thick red line is a fit to the points where fPL ≥ 25% and α ∈ [2.5,5]. The latter fit has a correlation coefficient r = 0.85 and slope s = 1.0.
Current usage metrics show cumulative count of Article Views (full-text article views including HTML views, PDF and ePub downloads, according to the available data) and Abstracts Views on Vision4Press platform.
Data correspond to usage on the plateform after 2015. The current usage metrics is available 48-96 hours after online publication and is updated daily on week days.
Initial download of the metrics may take a while.