Fig. 7
Download original image
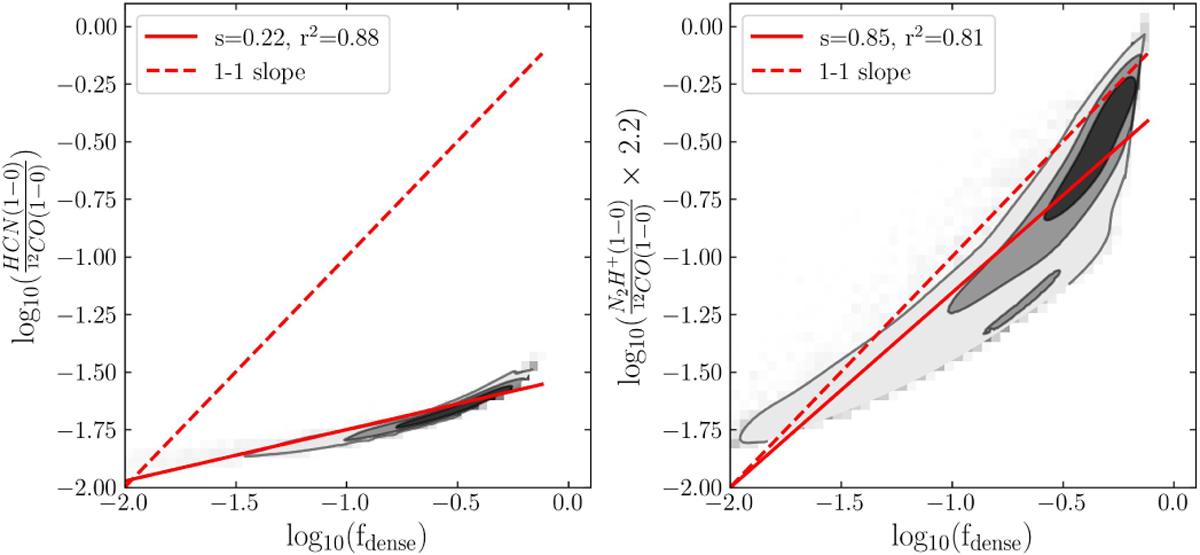
Beam-averaged line ratios between HCN(J = 1 → 0) (left) and N2H+( J =1 → 0) (right) over 12CO( J =1 → 0) as a function of flense, for a sample of 100 000 N-PDFs with parameters uniformly sampled over N0 ∈ [5 × 10²⁰ : 1022], α ∈ [2.5 : 5], σ ∈ [0.2 : 1.3], and rthres ∈ [2 : 100]. The dashed red line shows a linear relation, while the solid red line shows a linear fit to the data. This parameter space is more limited than the validity intervals of Table E.2, but more representative of N-PDFs observed in local clouds (Schneider et al. 2022).
Current usage metrics show cumulative count of Article Views (full-text article views including HTML views, PDF and ePub downloads, according to the available data) and Abstracts Views on Vision4Press platform.
Data correspond to usage on the plateform after 2015. The current usage metrics is available 48-96 hours after online publication and is updated daily on week days.
Initial download of the metrics may take a while.