Fig. A.1
Download original image
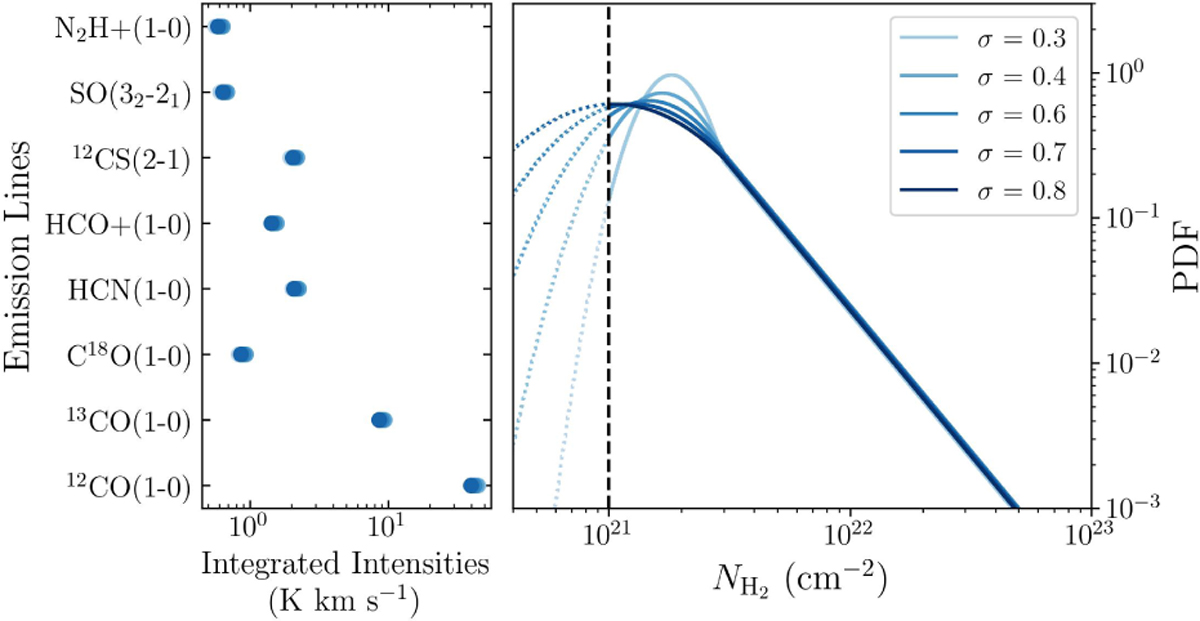
Left : model-predicted integrated intensities for a piecewise LN and PL N-PDF, with N0 = 2 × 1021 cm−2, rthres=1.5, α = 3 and σ increasing from 0.3 to 0.8. All predicted integrated intensities vary by 10% at most, which illustrates the degeneracy on the parameter σ in the particular case of low N0 and strong PL component. The right panel displays the corresponding N-PDF with varying σ. The dashed vertical line shows the column density limit below which the emission of all lines is less than 0.1 K km s−1 .
Current usage metrics show cumulative count of Article Views (full-text article views including HTML views, PDF and ePub downloads, according to the available data) and Abstracts Views on Vision4Press platform.
Data correspond to usage on the plateform after 2015. The current usage metrics is available 48-96 hours after online publication and is updated daily on week days.
Initial download of the metrics may take a while.