Fig. 2.
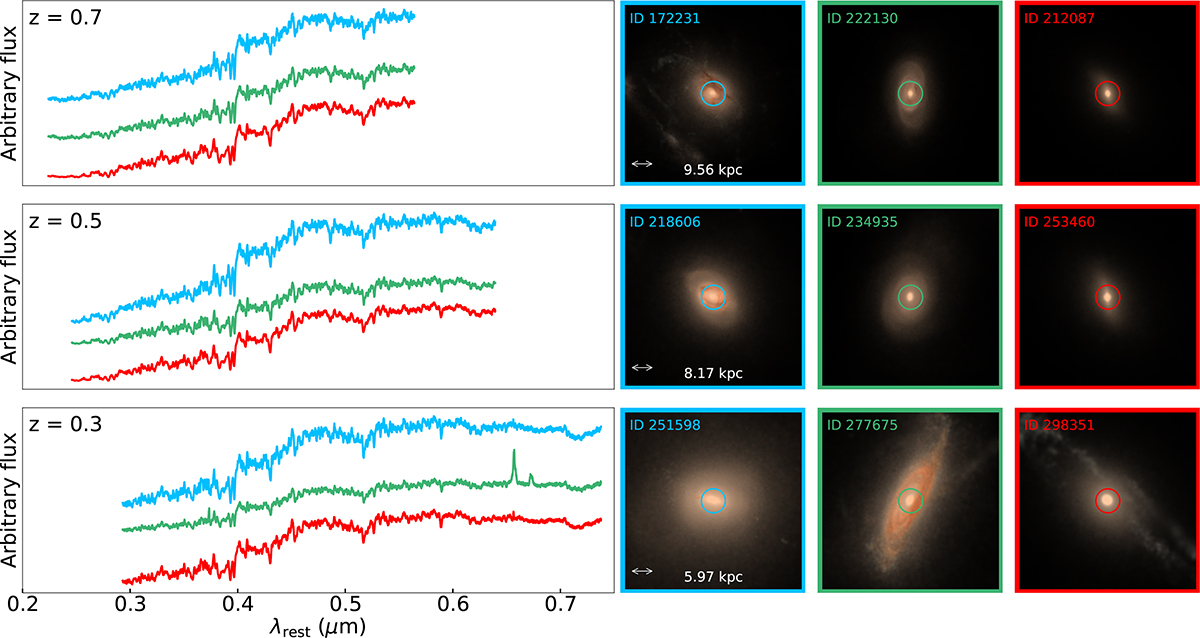
Download original image
Rest-frame spectra (first column) and RGB images (second to fourth columns) for three example galaxies at redshift z = 0.7 (top row), z = 0.5 (middle row), and z = 0.3 (bottom row), respectively. The first column demonstrates fibre spectra extracted from the central 1.3 arcsec of each galaxy, with arbitrary offset applied in the flux (linear units). In each panel of the first column: green spectra are extracted from galaxy ID 222130, ID 234935, and ID 277675, respectively; blue spectra from galaxy ID 172231, ID 218606, and ID 251598, respectively; red spectra from galaxy ID 212087, ID 253460, and ID 298351, respectively. The fibre size and corresponding physical size are also shown.
Current usage metrics show cumulative count of Article Views (full-text article views including HTML views, PDF and ePub downloads, according to the available data) and Abstracts Views on Vision4Press platform.
Data correspond to usage on the plateform after 2015. The current usage metrics is available 48-96 hours after online publication and is updated daily on week days.
Initial download of the metrics may take a while.