Fig. 3.
Download original image
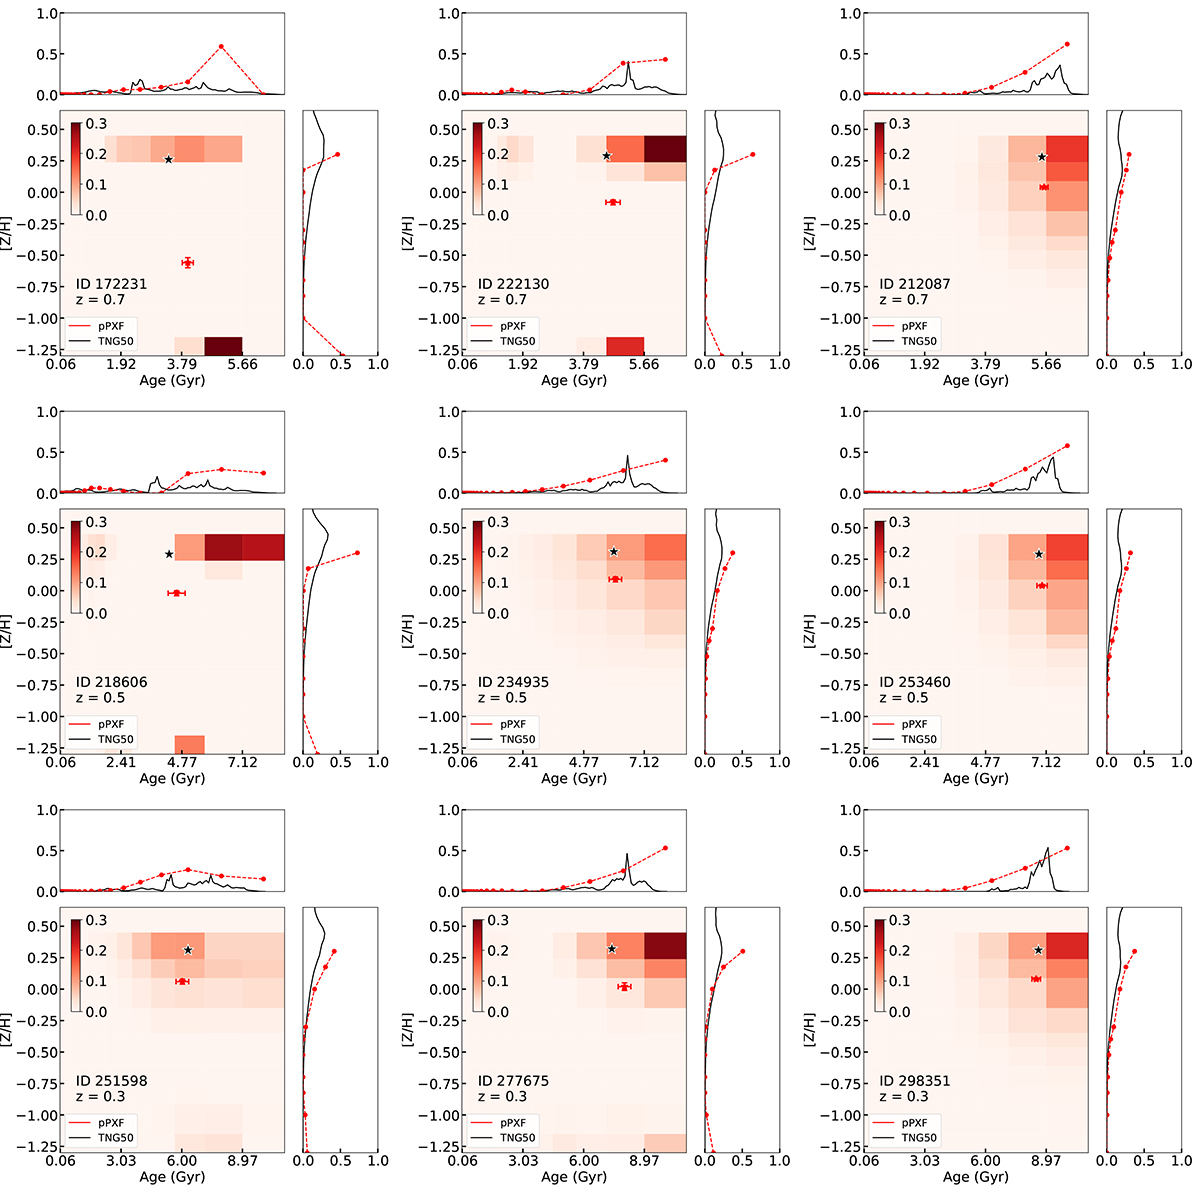
Distribution of the pPXF weights (red colours), indicating the mass fraction of each stellar population of given age and metallicity, derived from fibre noiseless spectra. The mass-weighted age and metallicity measured with pPXF is shown as a red star, while mass-weighted age and metallicity derived from the simulation is marked as a black star. Black lines represent the marginalised distribution of ages and metallicities derived from the simulation, while red curves show those inferred from pPXF. The progenitor galaxies at z = 0.7 are shown in the top row, while their descendants at z = 0.5 and z = 0.3 are shown in the middle and bottom rows, respectively.
Current usage metrics show cumulative count of Article Views (full-text article views including HTML views, PDF and ePub downloads, according to the available data) and Abstracts Views on Vision4Press platform.
Data correspond to usage on the plateform after 2015. The current usage metrics is available 48-96 hours after online publication and is updated daily on week days.
Initial download of the metrics may take a while.