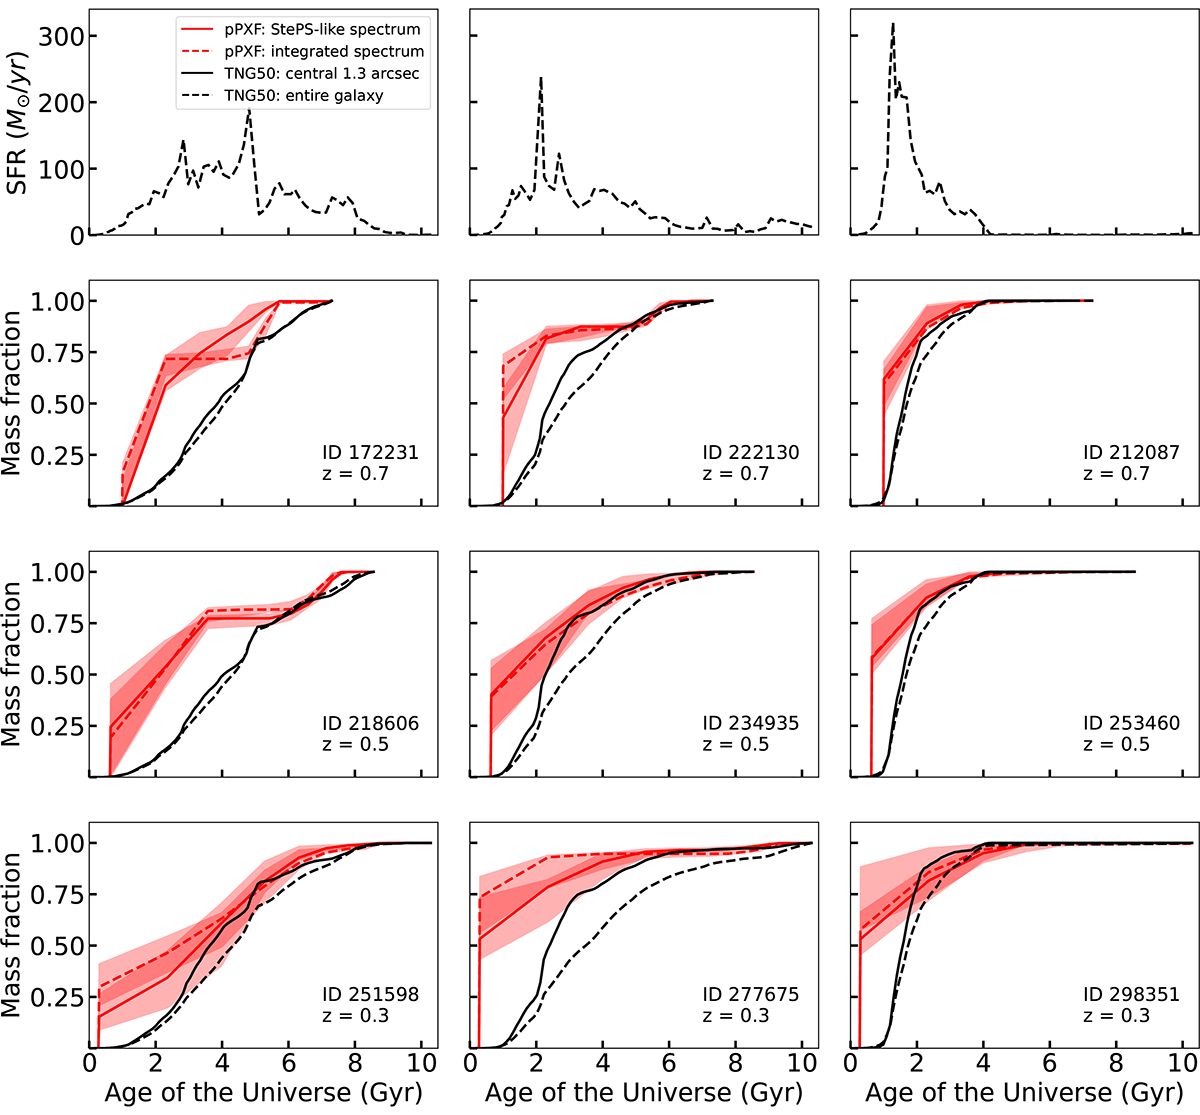
Fig. 4.
Download original image
Examples of SFHs (first row) and cumulative SFHs of the target galaxies at redshift z = 0.7 (second row), z = 0.5 (third row), and z = 0.3 (fourth row). The SFHs are derived directly from the cosmological simulation and represent the sum of the SFRs of all progenitors at each snapshot. The cumulative SFHs of each galaxy are retrieved by fitting with pPXF both the StePS-like fibre spectra (red solid line) and integrated noiseless spectra (red dashed line). The shaded red regions indicate the 16th–84th percentile range across 100 bootstrap realisations. For comparison, the cumulative SFHs derived directly from the cosmological simulation are shown both for the entire galaxy (black dashed line) and for the central 1.3 arcsec (black solid line).
Current usage metrics show cumulative count of Article Views (full-text article views including HTML views, PDF and ePub downloads, according to the available data) and Abstracts Views on Vision4Press platform.
Data correspond to usage on the plateform after 2015. The current usage metrics is available 48-96 hours after online publication and is updated daily on week days.
Initial download of the metrics may take a while.