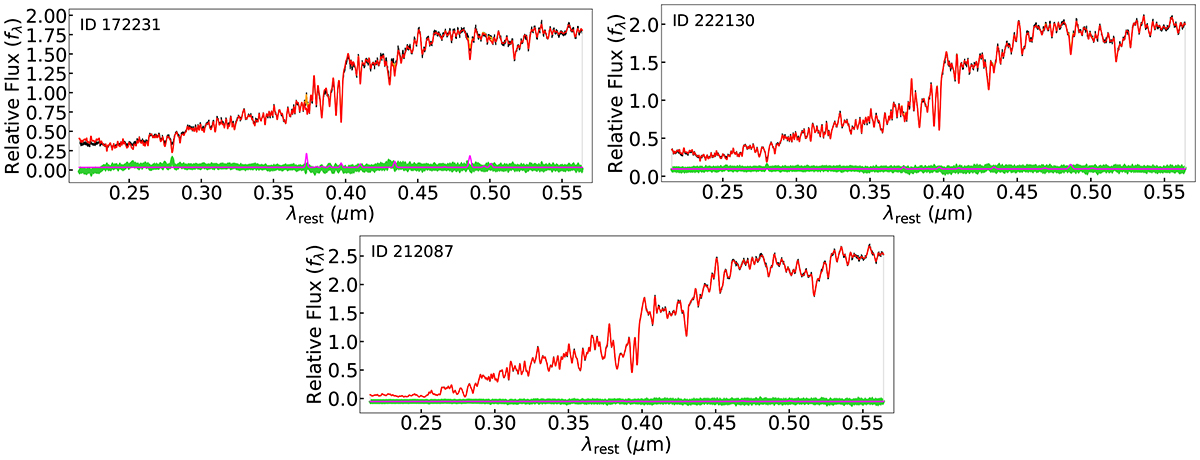
Fig. B.1.
Download original image
Example of full spectral fitting performed with pPXF for three galaxies at redshift z = 0.7. The rest-frame noiseless spectra (black solid lines) are plotted with the best-fitting model (orange lines). Each emission line is modelled with one kinematic component. The best-fitting stellar spectrum alone and the gas emissions alone are shown with red and magenta solid lines, respectively. The residuals (green diamonds; arbitrarily offset) are calculated by subtracting the model from the observed spectrum.
Current usage metrics show cumulative count of Article Views (full-text article views including HTML views, PDF and ePub downloads, according to the available data) and Abstracts Views on Vision4Press platform.
Data correspond to usage on the plateform after 2015. The current usage metrics is available 48-96 hours after online publication and is updated daily on week days.
Initial download of the metrics may take a while.