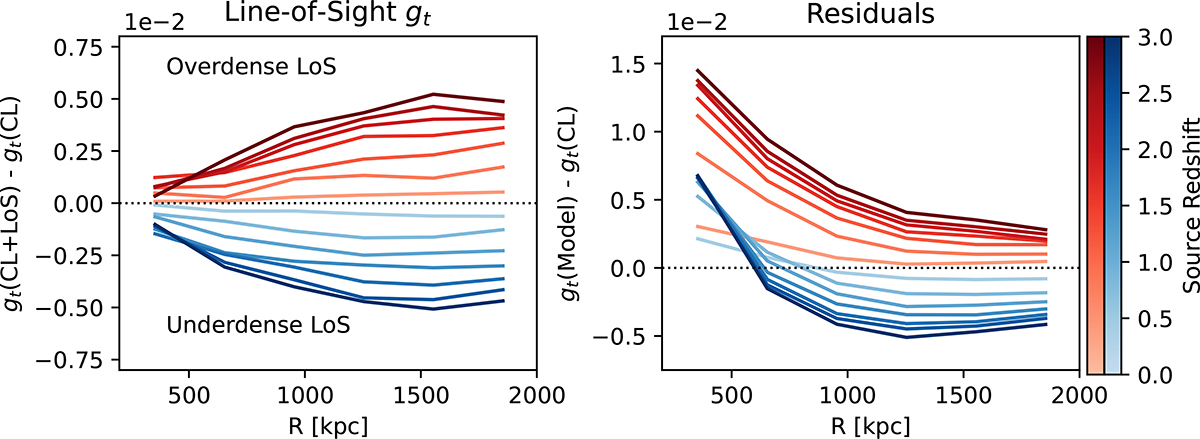
Fig. 2.
Download original image
Two subsamples resulting from the subdivision of the main sample, based on their having an over-dense (red) or under-dense (blue) LoS for a given source redshift (shaded colours). Left: Median azimuthally averaged reduced tangential shear contribution from the LoS, calculated as the difference between the reduced tangential shear from the CL+LoS mock and the CL mock, as a function of radius. Right: Median azimuthally averaged residuals, calculated as the difference between the reduced tangential shear from the best-fit model and the CL mock. On average, the residuals for clusters lying along over-dense and under-dense sight-lines are asymmetrically distributed around zero, potentially leading to a bias.
Current usage metrics show cumulative count of Article Views (full-text article views including HTML views, PDF and ePub downloads, according to the available data) and Abstracts Views on Vision4Press platform.
Data correspond to usage on the plateform after 2015. The current usage metrics is available 48-96 hours after online publication and is updated daily on week days.
Initial download of the metrics may take a while.