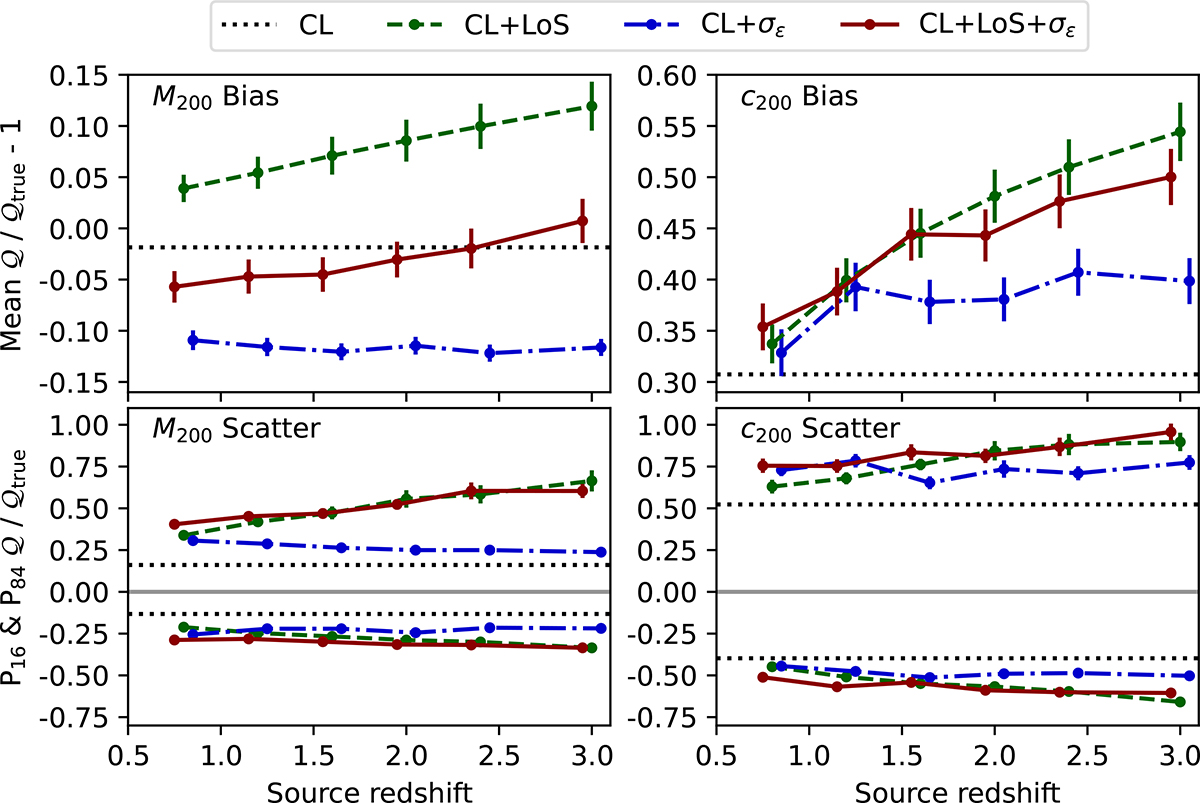
Fig. 3.
Download original image
Applying the sphNFW model we show the mean bias (top row) and scatter (bottom row) as a function of source redshift for the cluster’s mass (left column) and concentration (right column), for our four mocks CL (black-dotted), CL+LoS (green-dashed), CL+σϵ (blue-dot-dashed) and CL+LoS+σϵ (red-solid). We estimate the bias of quantity ‘𝒬’ as the mean of the relative error distribution minus 1. We estimate the upper bound scatter (+) and lower bound scatter (−) using the 84th and 16th percentile of the relative error distribution, respectively.
Current usage metrics show cumulative count of Article Views (full-text article views including HTML views, PDF and ePub downloads, according to the available data) and Abstracts Views on Vision4Press platform.
Data correspond to usage on the plateform after 2015. The current usage metrics is available 48-96 hours after online publication and is updated daily on week days.
Initial download of the metrics may take a while.