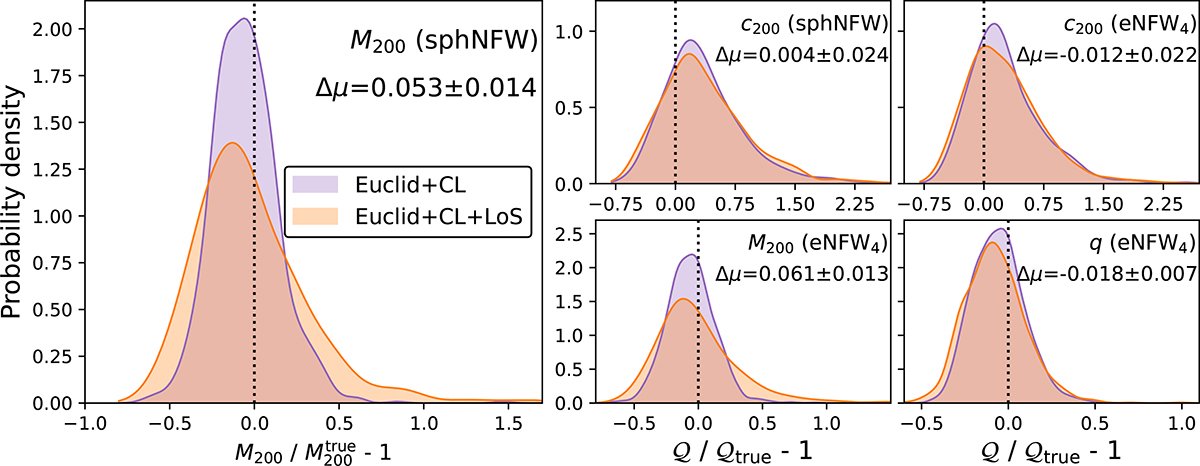
Fig. 5.
Download original image
Relative error distributions for the best-fit parameters in the Euclid+CL (purple) and Euclid+CL+LoS (orange) mocks. We show the relative error distribution for mass (left panel); concentration (right panel: top-left) under the assumption of the sphNFW model; and mass (right panel: bottom-left); concentration (right panel: top-right); and axis ratio (right panel: bottom-right) under the assumption of the eNFW4 model. We report the difference of the means (Δμ) and it’s bootstrapped uncertainty on the top right of each panel. For Euclid-like data, LoS structure positively biases mass estimates with the sphNFW model on the level of +5.3 ± 1.4%, which is significant at 3.5σ.
Current usage metrics show cumulative count of Article Views (full-text article views including HTML views, PDF and ePub downloads, according to the available data) and Abstracts Views on Vision4Press platform.
Data correspond to usage on the plateform after 2015. The current usage metrics is available 48-96 hours after online publication and is updated daily on week days.
Initial download of the metrics may take a while.