Open Access
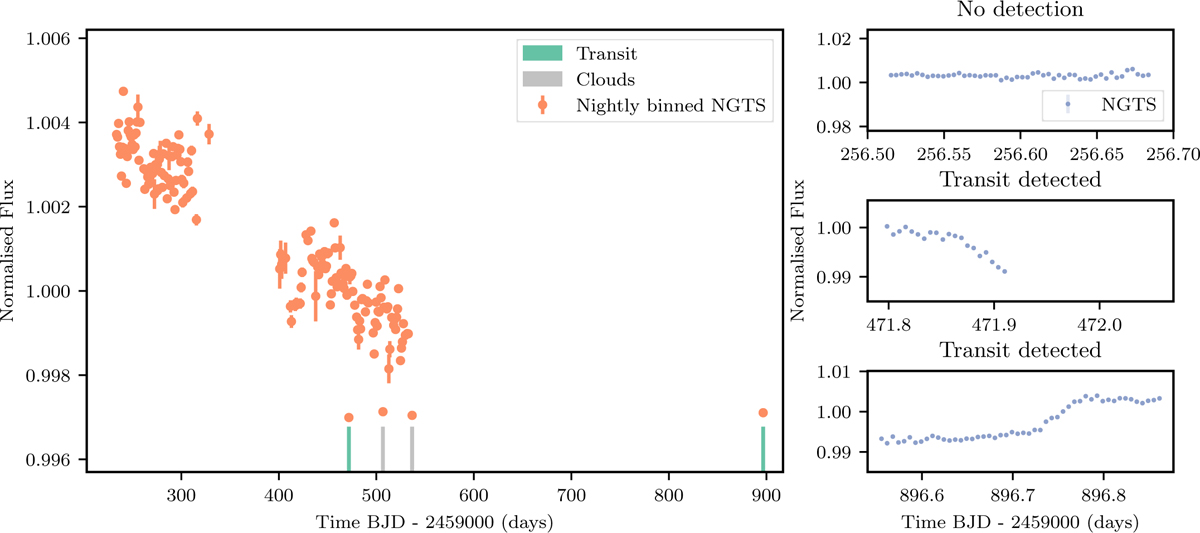
Fig. B.1
Download original image
NGTS flux time series of TOI-2449. Left panel: Nightly binned NGTS data from January 2021 to November 2022 (orange dots). Right panel: Example of NGTS observations (blue dots) during a clear night with no detection (binned to 5 minutes; top), a clear night with a transit detection (binned to 10 minutes; middle and bottom).
Current usage metrics show cumulative count of Article Views (full-text article views including HTML views, PDF and ePub downloads, according to the available data) and Abstracts Views on Vision4Press platform.
Data correspond to usage on the plateform after 2015. The current usage metrics is available 48-96 hours after online publication and is updated daily on week days.
Initial download of the metrics may take a while.