Open Access
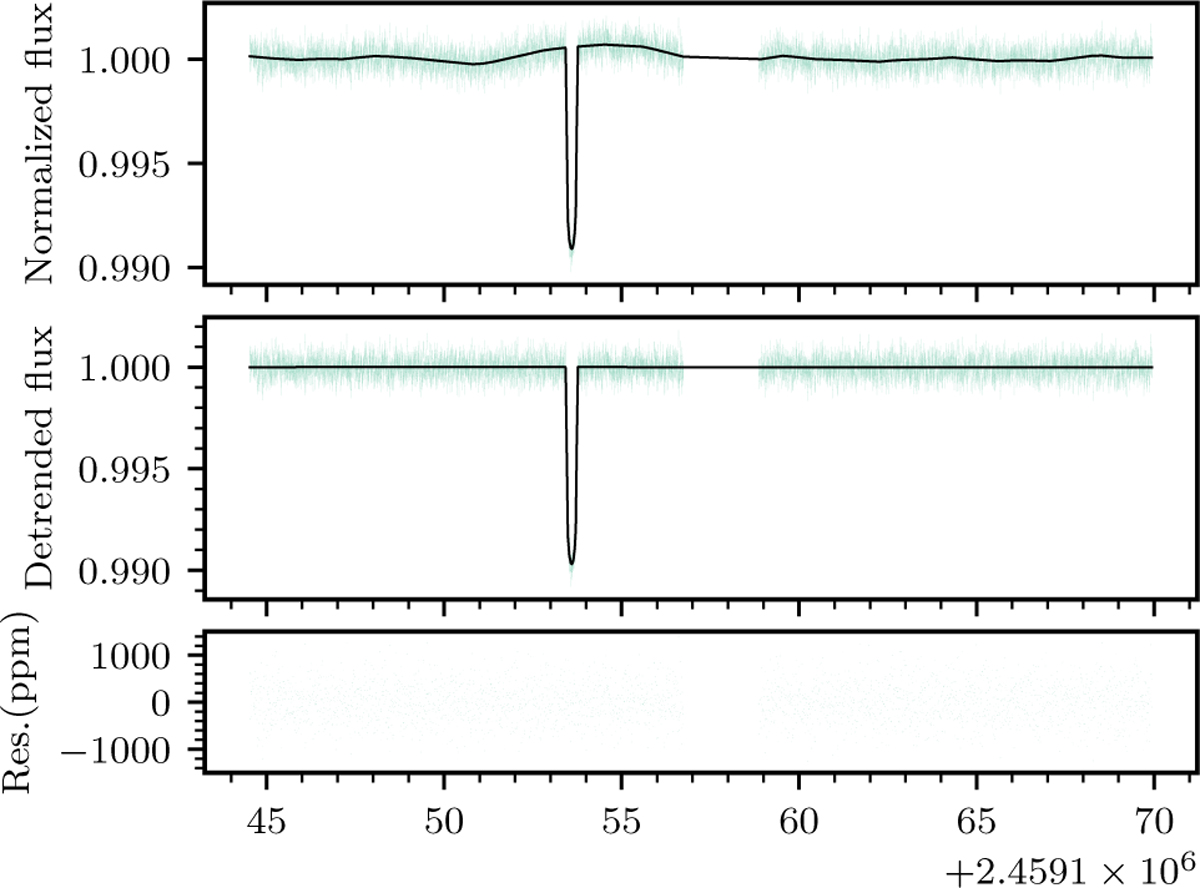
Fig. G.1
Download original image
TESS photometric observations (green dots) with the median transit model (black line). Top: PDCSAP TESS light curves. Middle: Detrended TESS light curves. Bottom: Residuals between the median model and the TESS light curve.
Current usage metrics show cumulative count of Article Views (full-text article views including HTML views, PDF and ePub downloads, according to the available data) and Abstracts Views on Vision4Press platform.
Data correspond to usage on the plateform after 2015. The current usage metrics is available 48-96 hours after online publication and is updated daily on week days.
Initial download of the metrics may take a while.