Fig. A.1.
Download original image
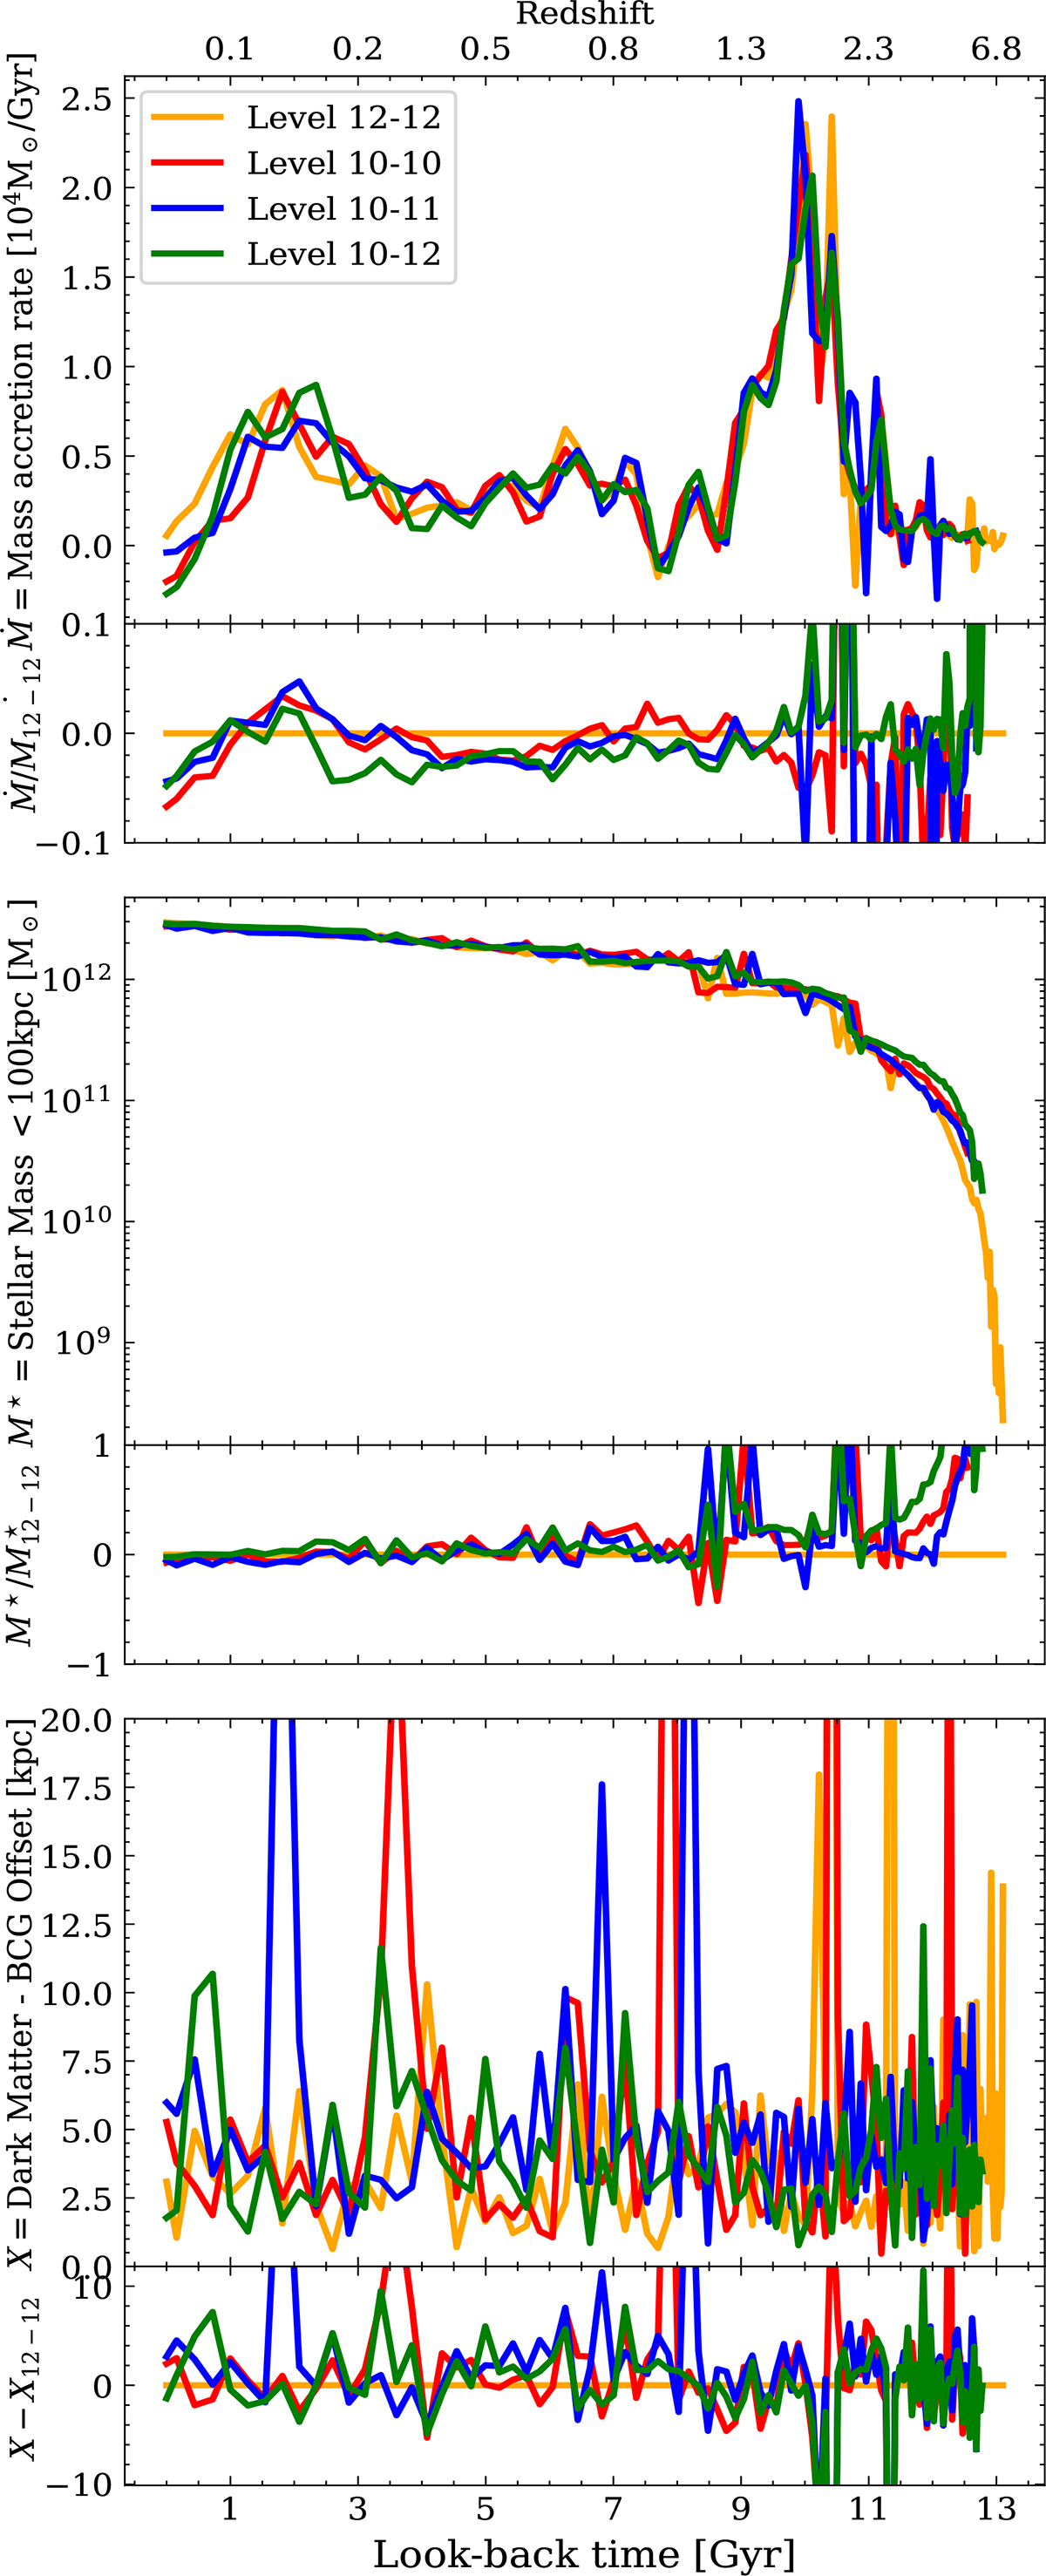
Additional convergence tests. Each panel shows results from the same halo for four different resolutions as found in Figure 1, where the first number corresponds to the level used in MUSIC for the gas mass, and the second for the dark matter. Each figure shows the absolute value in the top panel and the value relative to the high resolution, level 12-12, simulation in the bottom panel. From left to right, we show the mass accretion rate, the stellar mass within 100kpc, and the dark matter - brightest cluster galaxy offset. As expected we find no clear difference between the different runs in all cases.
Current usage metrics show cumulative count of Article Views (full-text article views including HTML views, PDF and ePub downloads, according to the available data) and Abstracts Views on Vision4Press platform.
Data correspond to usage on the plateform after 2015. The current usage metrics is available 48-96 hours after online publication and is updated daily on week days.
Initial download of the metrics may take a while.