Fig. 3.
Download original image
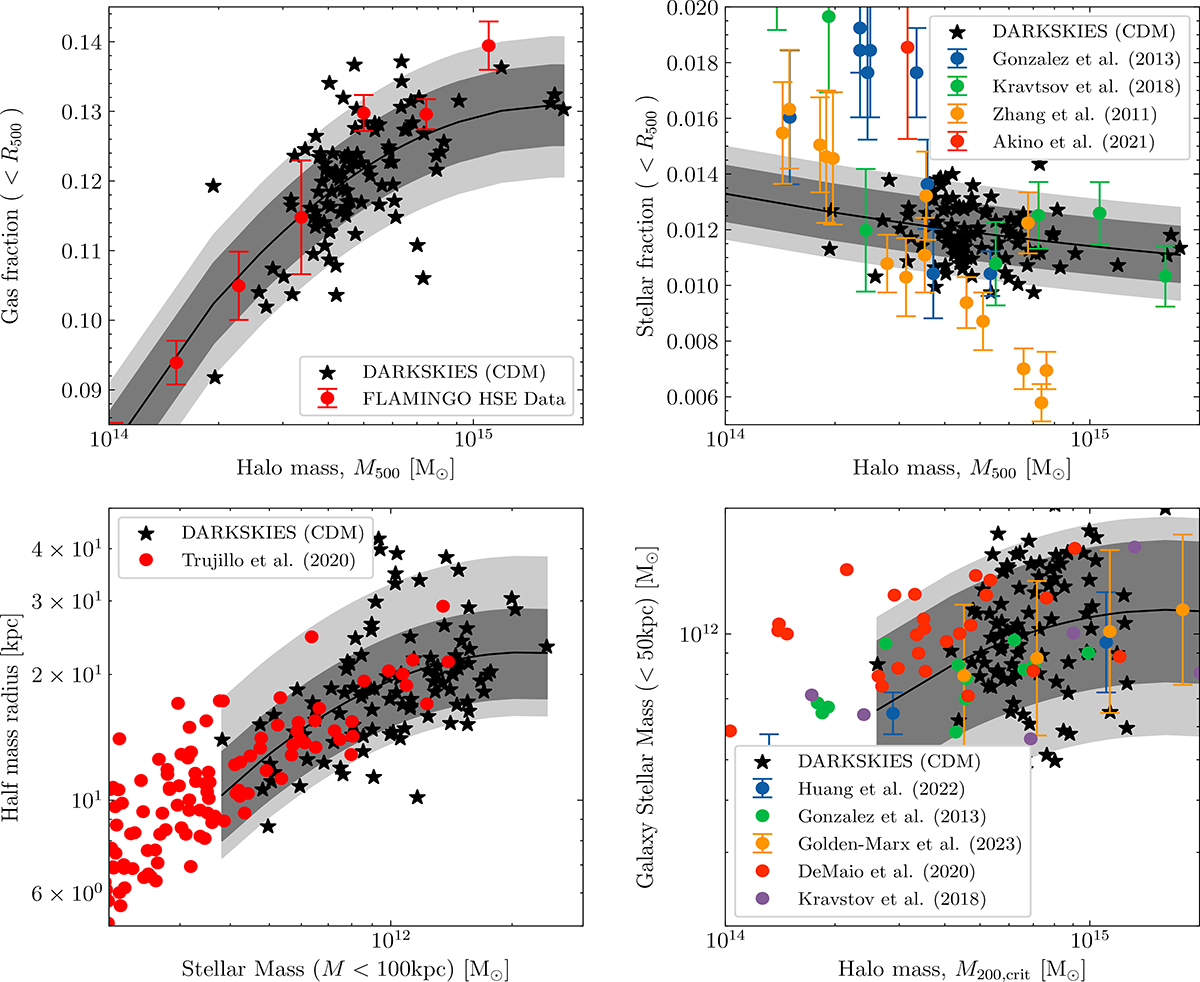
Final calibrated set of DARKSKIES CDM clusters. In each panel, we show the zoom-in, super-sampled clusters with CDM in black stars. Specifically, top left: Gas fraction inside r500 as a function of the halo mass M500, top right: Stellar fraction inside r500 as a function of the halo mass M500, bottom left: Projected half-mass radius of the central galaxy (considering all stars inside 100 kpc) as a function of projected stellar mass within 100 kpc, bottom right: Projected stellar mass within 100 kpc as a function of halo mass. The Flamingo HST Data corresponds to a collection of gas mass estimates collated by the Flamingo team (Hoekstra et al. 2015; Eckert et al. 2016; Akino et al. 2022; Lin et al. 2012; Lovisari et al. 2015; Sun et al. 2009; Vikhlinin et al. 2006). The solid line in each case shows the best fit, and the regions show the 68% and 95% representing the one and two standard deviation confidence limits around this fit.
Current usage metrics show cumulative count of Article Views (full-text article views including HTML views, PDF and ePub downloads, according to the available data) and Abstracts Views on Vision4Press platform.
Data correspond to usage on the plateform after 2015. The current usage metrics is available 48-96 hours after online publication and is updated daily on week days.
Initial download of the metrics may take a while.