Fig. 5.
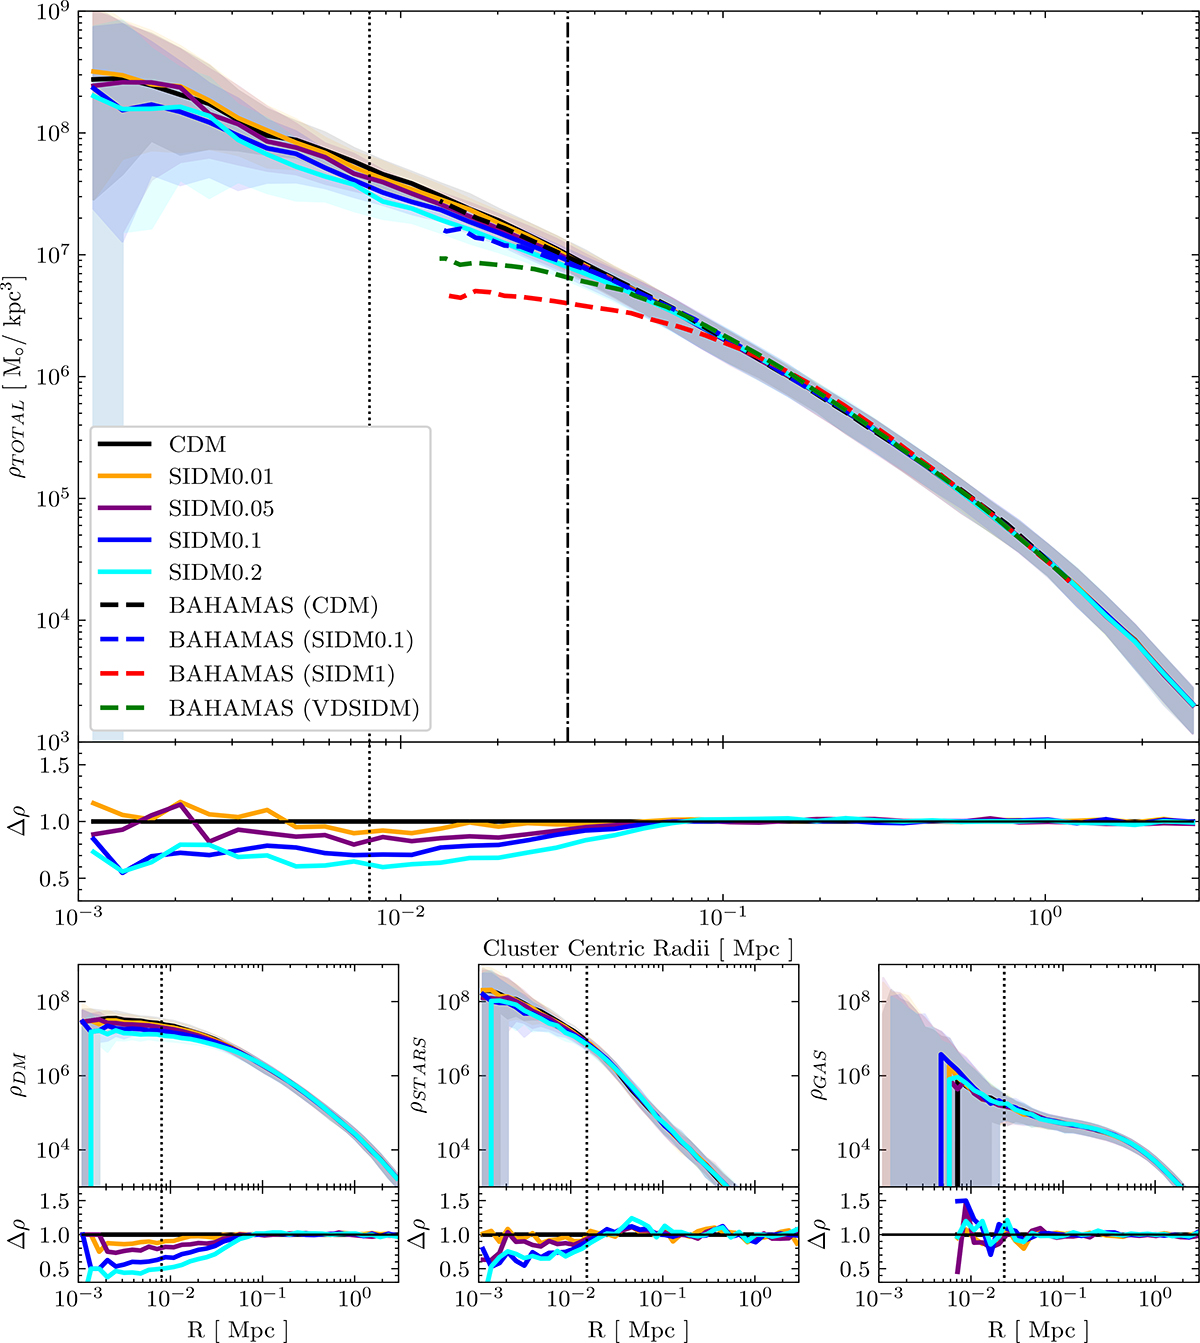
Download original image
Total (top panel), dark matter (bottom left panel), stellar (bottom middle panel), and gas (bottom right panel) mass density profiles as a function of self-interaction cross-section. In each case, we show the density relative to CDM, and in the main panel, we show the BAHAMAS SIDM simulations as dashed lines. In each case, the shaded region shows the 16% and 84% of the simulations.
Current usage metrics show cumulative count of Article Views (full-text article views including HTML views, PDF and ePub downloads, according to the available data) and Abstracts Views on Vision4Press platform.
Data correspond to usage on the plateform after 2015. The current usage metrics is available 48-96 hours after online publication and is updated daily on week days.
Initial download of the metrics may take a while.