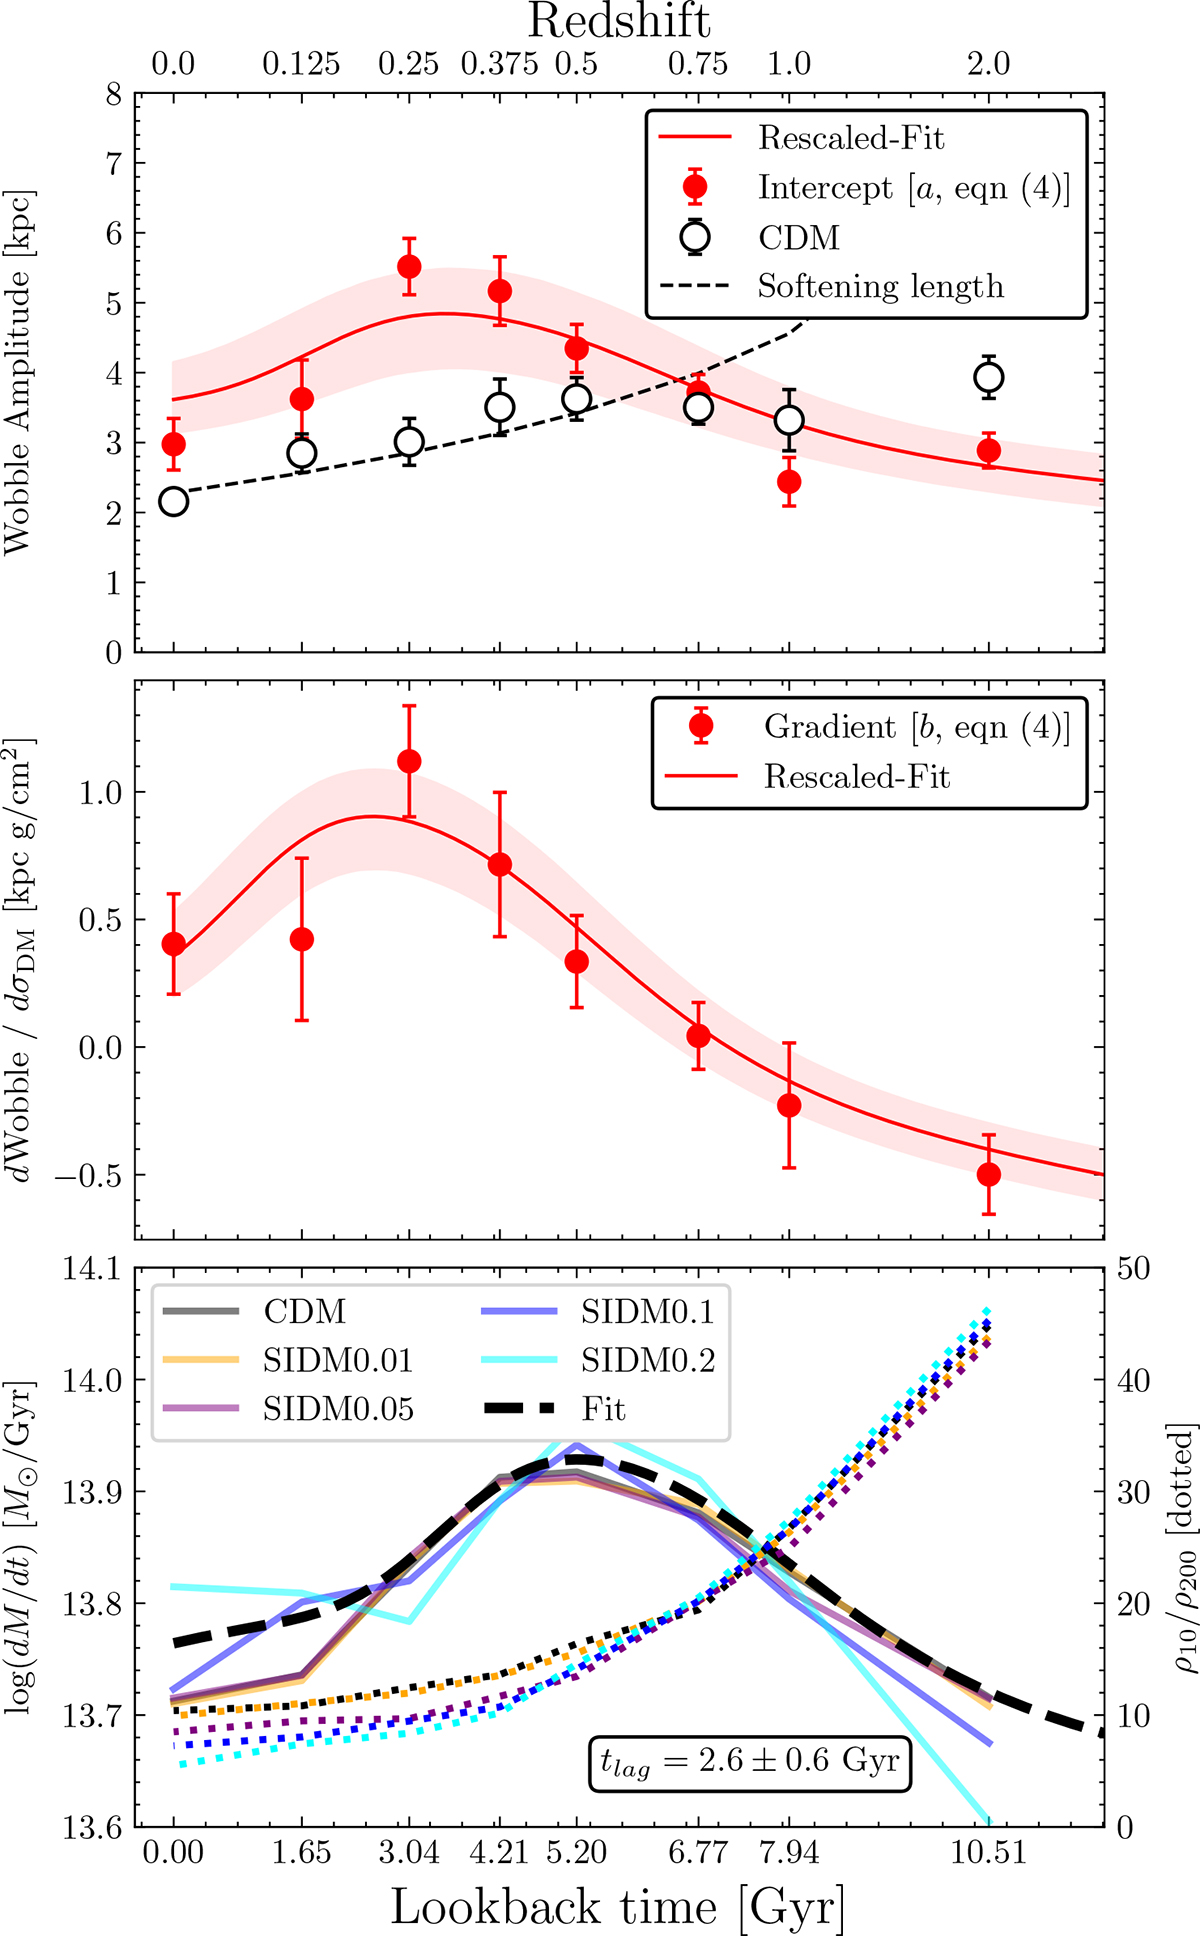
Fig. 8.
Download original image
Time evolution of the fits to Figure 7 parametrised by Eq. (7). The top panel shows the evolution of the intercept, a plus the absolute values of CDM and the evolving smooth length of the simulation. The middle panel shows the evolution of the gradient b as a function of look-back time (and respective redshift on the top axes). In both cases, the error bars of individual points come from the estimated error from scipy.curve_fit, and the shaded regions represent the 1 − σ error in rescaled fit of the mass accretion curve. To determine these, we performed Monte Carlo sampling of the fitted parameters around their uncertainties, drew random realisations of the fit, and found their 16% and 84%. The bottom panel shows the mean mass accretion for each model of dark matter as a function of look-back time. The thick dashed line is the best fitted model to the mean mass accretion, which is subsequently fitted to the top two panels by stretching in x and y (see Eq. (8)). The best fit is shown here in red (and the shaded region the 1σ error. We also calculated the shift between the peak of the mass accretion rate and the peak of the wobble.
Current usage metrics show cumulative count of Article Views (full-text article views including HTML views, PDF and ePub downloads, according to the available data) and Abstracts Views on Vision4Press platform.
Data correspond to usage on the plateform after 2015. The current usage metrics is available 48-96 hours after online publication and is updated daily on week days.
Initial download of the metrics may take a while.