Fig. 9.
Download original image
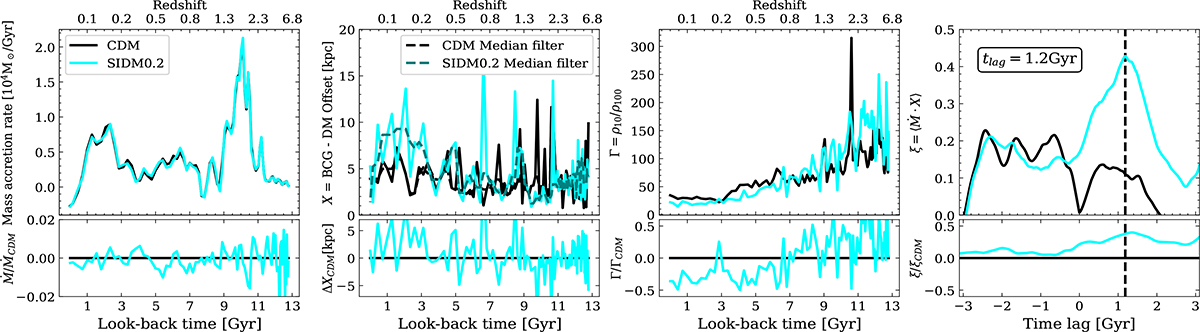
High-fidelity simulation of a single halo for two dark matter models. The left-hand figure shows the mass accretion rate over cosmic time, with the bottom panel showing the accretion relative to CDM. The middle panel shows the evolution of the offset between the dark matter and the BCG, with a median filter (kernel size of 1 Gyr) shown by the dashed line. The oscillations and wobbles can be clearly seen at redshifts z < 0.5. The bottom panel of the middle figure shows the difference between the offsets, showing how the SIDM0.2 grows at late times. The final, right-hand figure shows the correlation between the mass accretion rate, Ṁ and the offset between the dark matter and the BCG (X) as a function of the time lag between the signals. We see that for this halo the peak correlation occurs at 1.3 Gyr, consistent with the over-distribution found in the bottom panel of Figure 8.
Current usage metrics show cumulative count of Article Views (full-text article views including HTML views, PDF and ePub downloads, according to the available data) and Abstracts Views on Vision4Press platform.
Data correspond to usage on the plateform after 2015. The current usage metrics is available 48-96 hours after online publication and is updated daily on week days.
Initial download of the metrics may take a while.