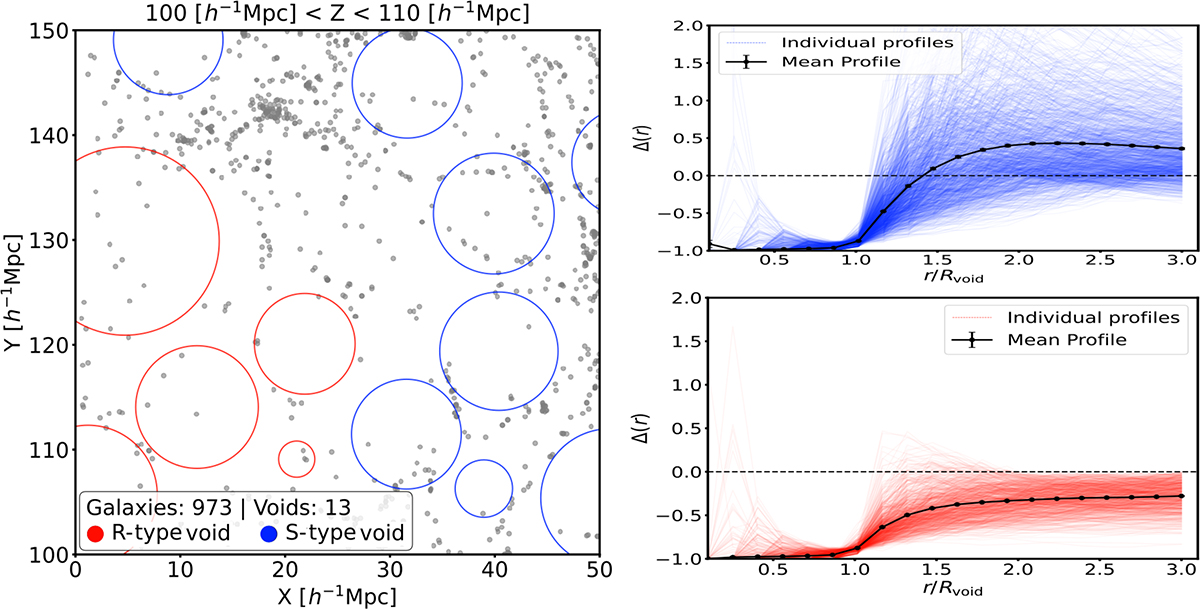
Fig. 1.
Download original image
Fiducial sample of cosmic voids, separated by type (see text). Left: Spatial distribution of galaxies and cosmic voids in a 10 h−1 Mpc slice (100 < z[h−1 Mpc] < 110) extracted from the TNG300 simulation box. Gray dots represent galaxies in the parent catalog within this region. Blue and red circles indicate the cross-sectional radii of R-type and S-type voids, respectively, from the fiducial sample that intersects this slice. Right: Integrated density profiles, Δ(r), as a function of normalized radius, r/Rvoid, for the complete fiducial void sample. The upper panel shows S-type voids (blue), while the lower panel displays R-type voids (red). Individual void profiles are shown as thin colored lines, with the mean profile and mean error bars represented by the thick black line and points. The horizontal dashed line at Δ(r) = 0 indicates the cosmic mean density.
Current usage metrics show cumulative count of Article Views (full-text article views including HTML views, PDF and ePub downloads, according to the available data) and Abstracts Views on Vision4Press platform.
Data correspond to usage on the plateform after 2015. The current usage metrics is available 48-96 hours after online publication and is updated daily on week days.
Initial download of the metrics may take a while.