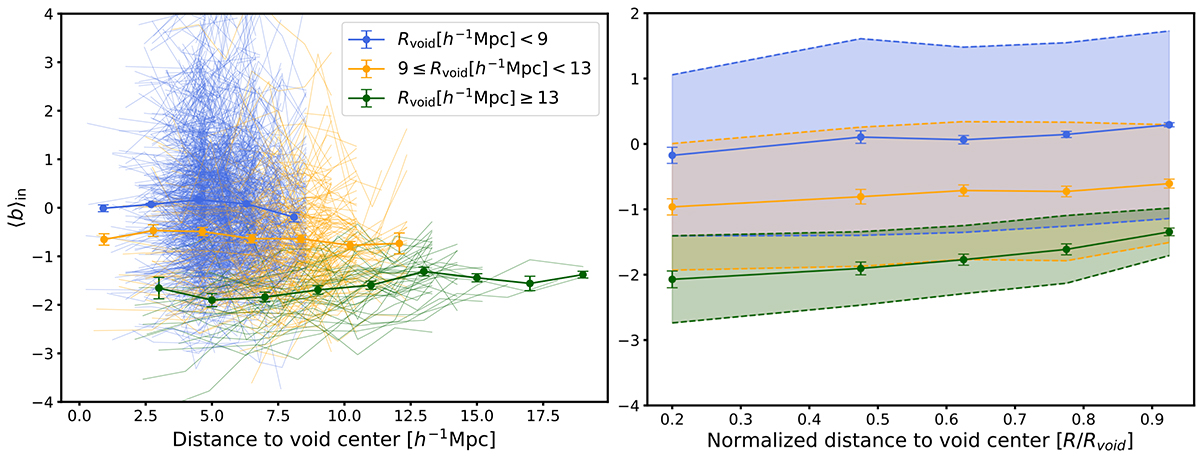
Fig. 3.
Download original image
Galaxy bias profile inside voids as a function of void size. Left: Average galaxy bias as a function of distance to the center of each void in our fiducial void sample. Three different void radius ranges are indicated by color. The average galaxy bias profile for each of these subsets is also shown, where uncertainties correspond to the errors on the means. Right: Average galaxy bias profile for the same subsets but using the void-centric distance normalized by void radius. Only central galaxies are employed in this analysis. A nonuniform binning is adopted to avoid discreteness issues in the innermost regions of voids (see text); this binning is maintained in all figures. In order to show intrinsic variation among the individual profiles, color bands representing the standard deviation in bias are included, along with the errors on the means.
Current usage metrics show cumulative count of Article Views (full-text article views including HTML views, PDF and ePub downloads, according to the available data) and Abstracts Views on Vision4Press platform.
Data correspond to usage on the plateform after 2015. The current usage metrics is available 48-96 hours after online publication and is updated daily on week days.
Initial download of the metrics may take a while.