Fig. 5.
Download original image
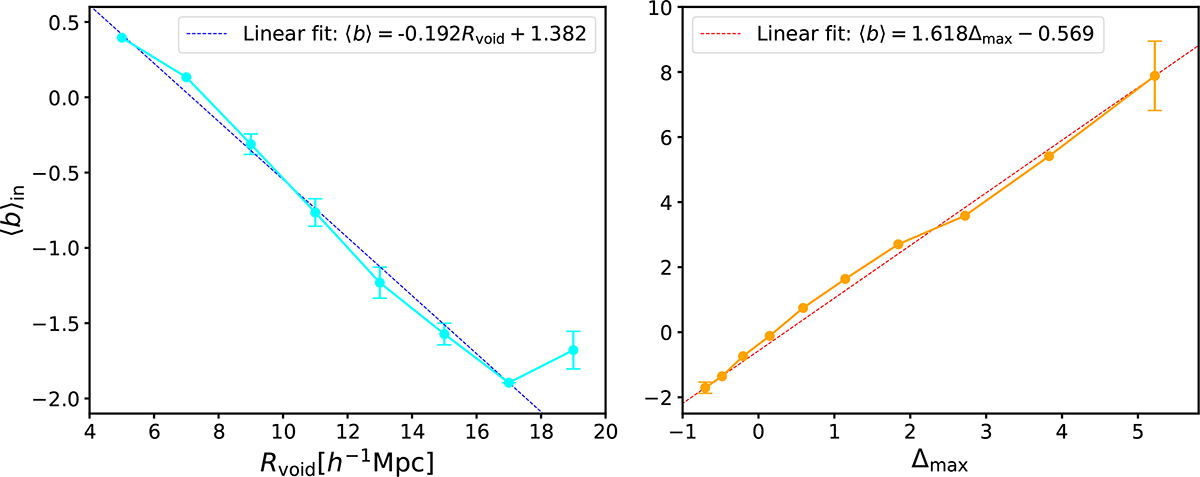
Average galaxy bias as a function of void radius, Rvoid (left), and maximum overdensity in the surrounding region, Δmax (right). The uncertainties correspond to the errors on the means. Note that, as shown in Fig. 2, voids with high values of Δmax, which also tend to have high bias, are very scarce. At fixed Rvoid, the population is dominated by lower-Δmax (lower-⟨b⟩ voids), which explains why the average bias only reaches ∼0.5 in the left panel of this figure.
Current usage metrics show cumulative count of Article Views (full-text article views including HTML views, PDF and ePub downloads, according to the available data) and Abstracts Views on Vision4Press platform.
Data correspond to usage on the plateform after 2015. The current usage metrics is available 48-96 hours after online publication and is updated daily on week days.
Initial download of the metrics may take a while.