Open Access
Fig. 6.
Download original image
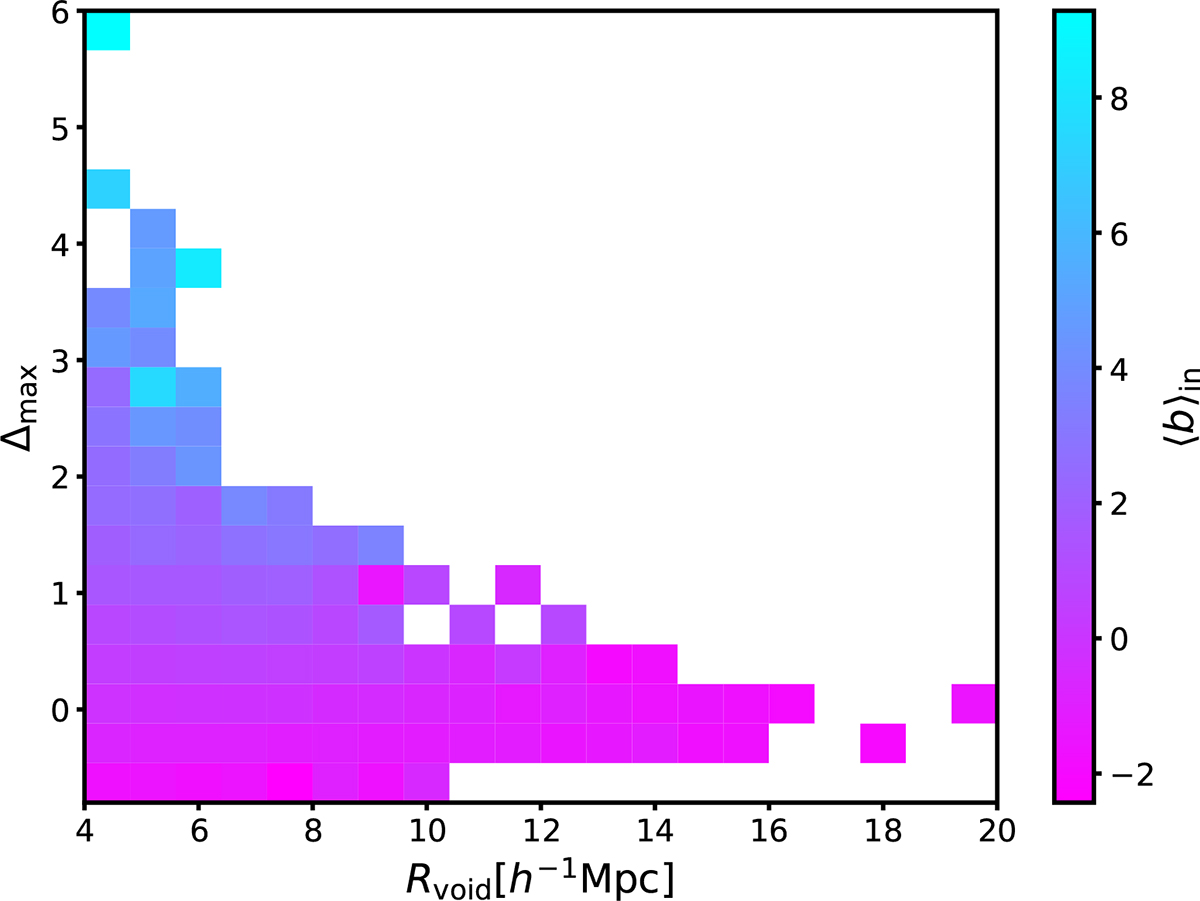
2D color map illustrating how galaxy bias varies as a function of both void radius (Rvoid) and maximum surrounding overdensity (Δmax). The color code indicates the mean galaxy bias inside the voids pertaining to each pixel.
Current usage metrics show cumulative count of Article Views (full-text article views including HTML views, PDF and ePub downloads, according to the available data) and Abstracts Views on Vision4Press platform.
Data correspond to usage on the plateform after 2015. The current usage metrics is available 48-96 hours after online publication and is updated daily on week days.
Initial download of the metrics may take a while.