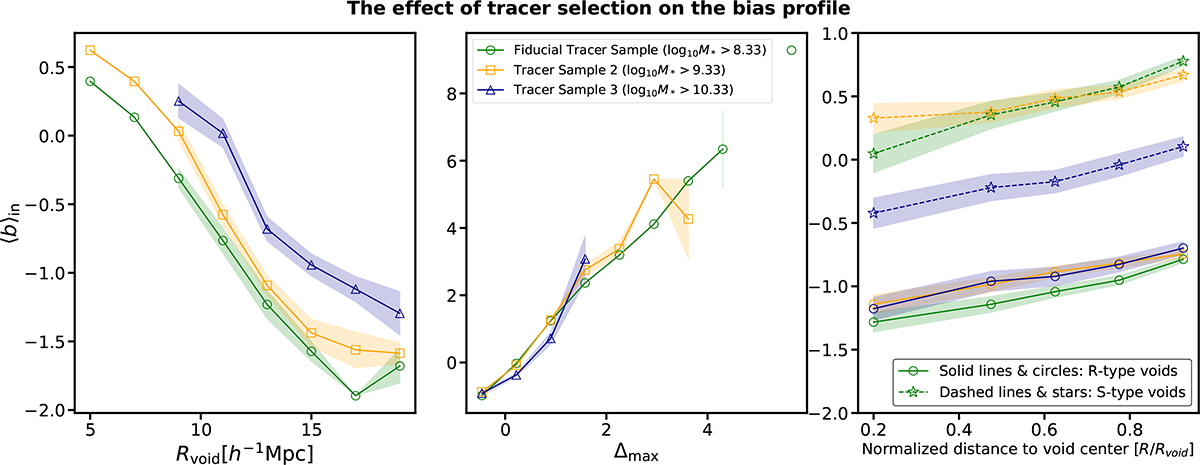
Fig. 7.
Download original image
Bias–size and bias–maximum surrounding overdensity relations (left, middle), along with the dependence of the bias profile on void type (right), for three different tracer samples with varying minimum stellar mass. The results shown in green correspond to our fiducial void sample, obtained from a galaxy catalog with log10(M* [h−1 M⊙]) > 8.33 (same as Figs. 4 and 5). Yellow and blue lines and symbols show the effect of increasing this threshold to log10(M*[h−1 M⊙]) > 9.33 and 10.33, respectively. Uncertainties (shaded regions) correspond again to the errors on the means.
Current usage metrics show cumulative count of Article Views (full-text article views including HTML views, PDF and ePub downloads, according to the available data) and Abstracts Views on Vision4Press platform.
Data correspond to usage on the plateform after 2015. The current usage metrics is available 48-96 hours after online publication and is updated daily on week days.
Initial download of the metrics may take a while.